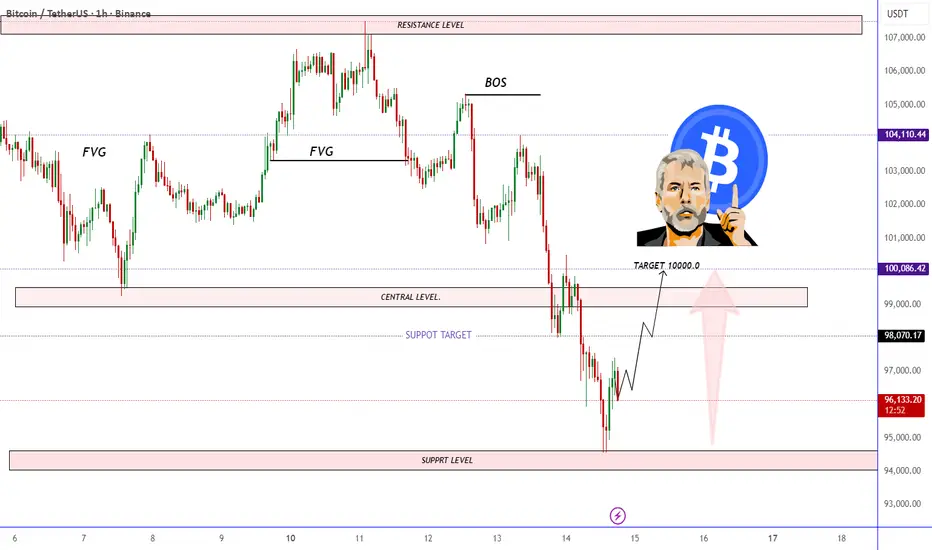
A Bitcoin price chart highlighting key ICT concepts including FVGs, BOS, support and resistance levels. The analysis suggests a potential bullish retracement from the support zone toward the central level, targeting the 100,000 USDT region. The layout shows expected price movement with marked liquidity zones and structural shifts.
액티브 트레이드
거래청산: 스탑 닿음
🎯XAUUSD GOLD BTCUSD Daily 4_5 Free Signals 🚀📊 join Telegram channel
t.me/Gold_blue_pipshunter
✨ Join My WhatsApp Premium Group! ✨ chat.whatsapp.com/EXNJ7pGViJbEKUCDbmTOwG
Join My WhatsApp Premium Group! ✨
t.me/Gold_blue_pipshunter
✨ Join My WhatsApp Premium Group! ✨ chat.whatsapp.com/EXNJ7pGViJbEKUCDbmTOwG
Join My WhatsApp Premium Group! ✨
면책사항
해당 정보와 게시물은 금융, 투자, 트레이딩 또는 기타 유형의 조언이나 권장 사항으로 간주되지 않으며, 트레이딩뷰에서 제공하거나 보증하는 것이 아닙니다. 자세한 내용은 이용 약관을 참조하세요.