Good good weekend everyone,
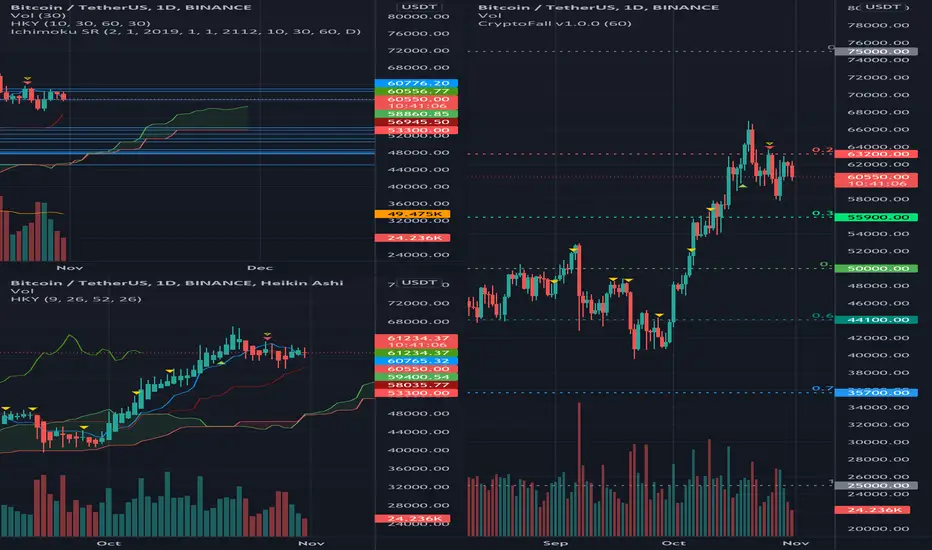
The Crypto Frog uses its Ichimoku Analysis Process by looking at a glance at the BINANCE:BTCUSDT Daily chart using the “Crypto Market Settings” for the indicator as 10-30-60-30:
Macro Trend Analysis using Kumo:
Static Supports and Resistances in the area:
Resistances
Supports
For the various static price structures it is possible to refer to the chart where the structures identified by the flat moments of Tenkan, Kijun, Senkou Span A and Senkou Span B on different timeframes are plotted.
Dynamic
The Crypto Frog uses its Ichimoku Analysis Process by looking at a glance at the BINANCE:BTCUSDT Daily chart using the “Crypto Market Settings” for the indicator as 10-30-60-30:
Macro Trend Analysis using Kumo:
- Tendency: The macro trend is up as Kumo has been green for about a month.
Medium-term we have a moment of laterality and the Kijun is strongly bullish due to the presence of the historical high in its calculation range, this should not mislead us.
In the short term the Tenkan Sen is bearish as well as its direction, which has stopped being influenced by the historical high, and the price is very close to the Kumo. Today in fact it opened above and the price is now below the Tenkan. - Price: The price is above the Kumo and above the Chikou. It is using the Tenkan Sen as a price structure.
- Width/Evolution: kumo is green, widening but seknou span b is flat.
Static Supports and Resistances in the area:
Resistances
- 75000.00 by Fibonacci
- 67000.00 by Historical Maximum (too much precise)
- 66001.41 by All-time-high Chikou
Supports
- 58000.00 strong price structure by flat lines
- 53800.00-54000 strong price structure by flat lines
For the various static price structures it is possible to refer to the chart where the structures identified by the flat moments of Tenkan, Kijun, Senkou Span A and Senkou Span B on different timeframes are plotted.
Dynamic
- Tenkan: downtrend (with an all-time-high bias out of the calculation)
- Kijun: uptrend (with an all-time-high bias)
- Volumes:
Stable
Heikin-Ashi:
uptrend with much strength, which is colliding with resistance.
Fibonacci
CryptoFall, which identifies Fibonacci levels, still shows us a positive sentiment and places the 0 upwards on 75000.
The price reached and then was rejected at the 0.236 level, confirmed the all-time high, in this moment it is sideways with a downtrend bias
ConclusionsConsidering that last week the all-time-high was touched, now the price is retracing.
It is important to evaluate the closing of the week on the following price structures: 58000 (bearish bias), on 62000 (sideways bias) or 63000 (bullish bias).
as last week the price is retracing, although right now it is quite sideways, after the new all-time high.
The frog is always cautious in these moments, a retracement on one of the indicated resistances could bring a good opportunity to accumulate BTC.
For altcoins it is a difficult moment as the total market cap is decreasing, the dominance of BTC and ETH is decreasing, as well as that of the various altcoins while stable coins are increasing. So the altcoins are sideways with a bearish bias, apart from some NFT outliers that - fundamentally - are the fashion of the moment.
Thanks for your attention, happy to support the TradingView community.
- Volumes:
- Scalping The Bull Indicator: linktr.ee/scalpingthebull
- Scalping The Bull Training: tinyurl.com/corsoindicatorepro
- AlgoTrading Training: tiny.one/corsopinescriptbase
- Crypto News: t.me/joinchat/StkXJM
- Scalping The Bull Training: tinyurl.com/corsoindicatorepro
- AlgoTrading Training: tiny.one/corsopinescriptbase
- Crypto News: t.me/joinchat/StkXJM
관련 발행물
면책사항
이 정보와 게시물은 TradingView에서 제공하거나 보증하는 금융, 투자, 거래 또는 기타 유형의 조언이나 권고 사항을 의미하거나 구성하지 않습니다. 자세한 내용은 이용 약관을 참고하세요.