I will give a practical demonstration here on how to draw your own order blocks and heat maps to predict if price will move up or down from this 121,400 current level.
First understand that stop loss order blocks are opposite to what we have learned as traders.
We are told that buy orders are below price (limit buys) and sell orders are above us (limit sells).
The truth of Bitcoin however is the exact opposite is true. The stop loss orders carry much more power than limit orders, as they are filled for the “whole leveraged position size”, not for only the margin used.
While limit buys will automatically fill if price is below that price, or limit sells will automatically fill if price is above that price - this is not true for stop loss orders or liquidation orders.
Stop Losses and Liquidations only FILL if price CROSSES the level.
This means we can use order blocks from open candle sets, extended out past price currently, to understand where these gaps of orders are located.
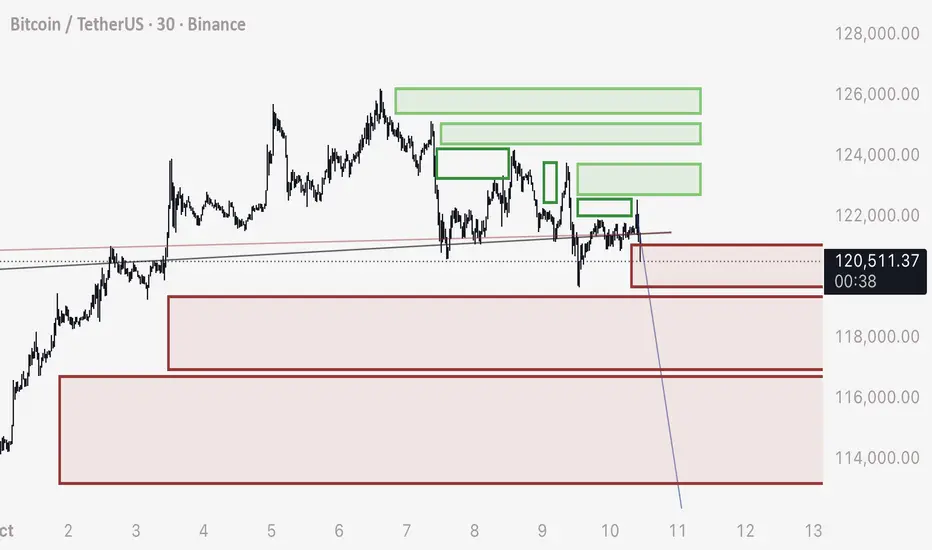
Green boxes for BUYS above price.
Red boxes for SELLS below price.
When price enters into these boxes zones, these orders will start filling - acting as a type of propellant that’s implanted in the chart from traders previous choices. This creates “wicks” and fast movements.
WILL PRICE GO UP OR DOWN FROM 21,400?
In this example from 121,400 I drew both long stops and sell stops.
The emptied green boxes have already been reclaimed. The filled in green boxes are left unreclaimed and contain these orders.
For price to go up, it would have to move past the previous wick, and enter into these zones - which have a significant gap in between them.
For price to DROP, we can look at the boxes of long stops or sell orders.
Note that these order blocks are neatly placed one after the next, with no significant gaps between them.
Therefor, there is much better odds of price dropping from 121,400 - entering into these sell order blocks, and naturally dropping as those orders are filled one into the other.
It would be a good day trade strategy to SHORT the 121,400 level, and expect the price to move down through these blocks.
It would be a bad day trade strategy to LONG the 121,400, as the orders are very few compared to the downside, therefor, lower odds.
This is really the only strategy you need to scalp trades on Bitcoin and predict where price is going.
If you find these helpful, please let me know below.
Yours truly,
- DD
First understand that stop loss order blocks are opposite to what we have learned as traders.
We are told that buy orders are below price (limit buys) and sell orders are above us (limit sells).
The truth of Bitcoin however is the exact opposite is true. The stop loss orders carry much more power than limit orders, as they are filled for the “whole leveraged position size”, not for only the margin used.
While limit buys will automatically fill if price is below that price, or limit sells will automatically fill if price is above that price - this is not true for stop loss orders or liquidation orders.
Stop Losses and Liquidations only FILL if price CROSSES the level.
This means we can use order blocks from open candle sets, extended out past price currently, to understand where these gaps of orders are located.
Green boxes for BUYS above price.
Red boxes for SELLS below price.
When price enters into these boxes zones, these orders will start filling - acting as a type of propellant that’s implanted in the chart from traders previous choices. This creates “wicks” and fast movements.
WILL PRICE GO UP OR DOWN FROM 21,400?
In this example from 121,400 I drew both long stops and sell stops.
The emptied green boxes have already been reclaimed. The filled in green boxes are left unreclaimed and contain these orders.
For price to go up, it would have to move past the previous wick, and enter into these zones - which have a significant gap in between them.
For price to DROP, we can look at the boxes of long stops or sell orders.
Note that these order blocks are neatly placed one after the next, with no significant gaps between them.
Therefor, there is much better odds of price dropping from 121,400 - entering into these sell order blocks, and naturally dropping as those orders are filled one into the other.
It would be a good day trade strategy to SHORT the 121,400 level, and expect the price to move down through these blocks.
It would be a bad day trade strategy to LONG the 121,400, as the orders are very few compared to the downside, therefor, lower odds.
This is really the only strategy you need to scalp trades on Bitcoin and predict where price is going.
If you find these helpful, please let me know below.
Yours truly,
- DD
관련 발행물
면책사항
해당 정보와 게시물은 금융, 투자, 트레이딩 또는 기타 유형의 조언이나 권장 사항으로 간주되지 않으며, 트레이딩뷰에서 제공하거나 보증하는 것이 아닙니다. 자세한 내용은 이용 약관을 참조하세요.
관련 발행물
면책사항
해당 정보와 게시물은 금융, 투자, 트레이딩 또는 기타 유형의 조언이나 권장 사항으로 간주되지 않으며, 트레이딩뷰에서 제공하거나 보증하는 것이 아닙니다. 자세한 내용은 이용 약관을 참조하세요.