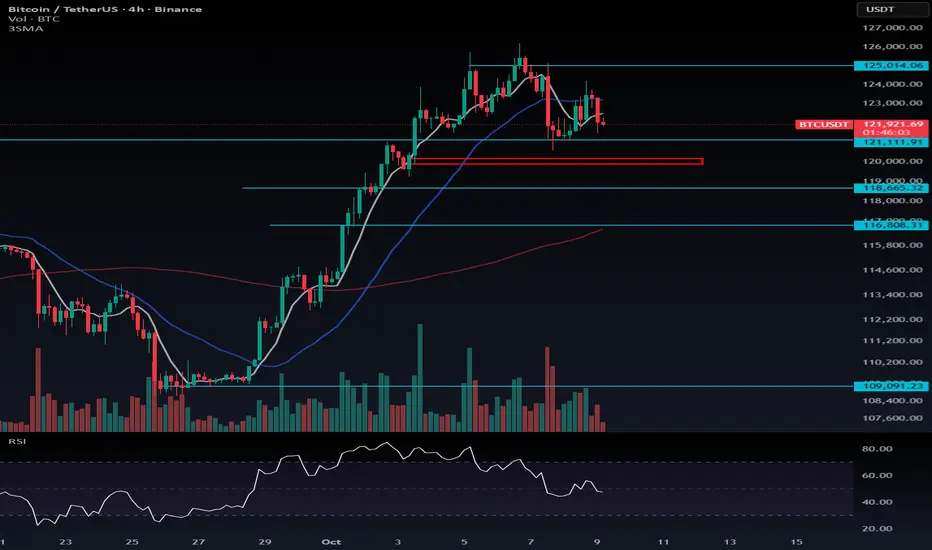
There’s a liquidity zone around $120,509, and once this level is taken out, the price could drop toward the $119,898–$120,150 range.
If Bitcoin sweeps that liquidity and then bounces back above, it would confirm the fakeout scenario I mentioned earlier — a bullish signal suggesting the continuation of the uptrend.
However, if BTC fails to recover after the sweep, the corrective move could extend further down toward the $118,665 support zone.
📉 Short Setup:
You can consider short positions if $120,111 breaks, but in my opinion, it’s better to enter slightly before the breakout, as the move could be sharp and quick.
📈 Long Setup:
The next strong long opportunity remains above $125,000.
If BTC Dominance starts printing green candles, it’s better to focus your short trades on altcoins, as they may show higher volatility and downside potential.
면책사항
이 정보와 게시물은 TradingView에서 제공하거나 보증하는 금융, 투자, 거래 또는 기타 유형의 조언이나 권고 사항을 의미하거나 구성하지 않습니다. 자세한 내용은 이용 약관을 참고하세요.
면책사항
이 정보와 게시물은 TradingView에서 제공하거나 보증하는 금융, 투자, 거래 또는 기타 유형의 조언이나 권고 사항을 의미하거나 구성하지 않습니다. 자세한 내용은 이용 약관을 참고하세요.