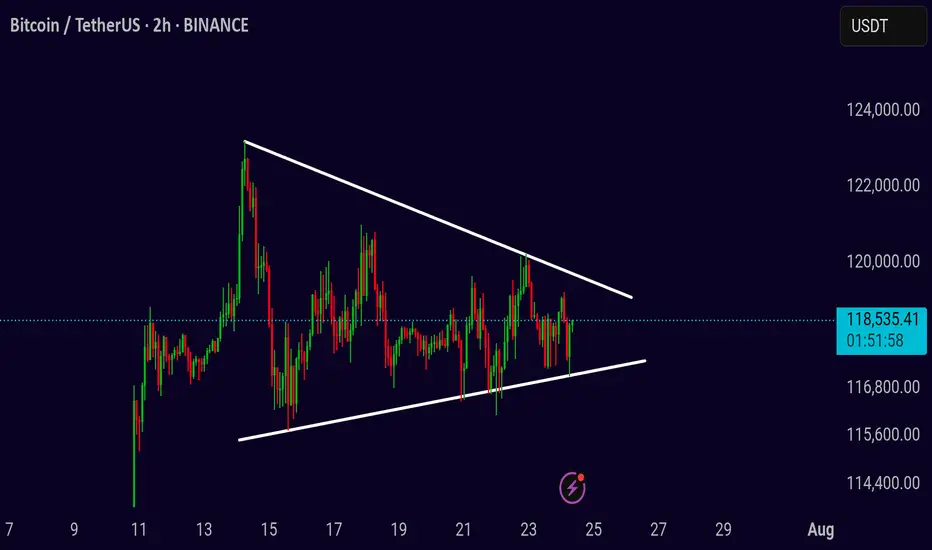
BTCUSDT Idea (2H Chart)
BTC is consolidating inside a symmetrical triangle, creating pressure for a breakout. Price is currently ranging between 116K–120K, with volatility compressing.
Patience is key here — don’t rush entries.
A confirmed breakout or breakdown will give the real direction.
Break above the triangle = bullish continuation
Break below = further correction ahead
Wait for 2H close outside the pattern with volume
Watch levels:
* Upside: 120K → 124K → 128K
* Downside: 116K → 112K → 108K
Setup is maturing — breakout is just a matter of time. Let the chart lead, not emotions.
액티브 트레이드
BTC updateThis is not a good trading zone right now, better to wait a few hours.
👀 Looking at this chart I’m leaning bearish for now, let’s see how it plays out.
📊 Trading Ideas & Signals
🚀 Free Entry/Exit Points
📢 Instant Market Updates
👉 t.me/cryptobyghazii
⚡ Quick & Volatile Trades
🔥 Fast Signals • High Accuracy
💹 For Rapid Market Moves
👉 t.me/The_Real_Oracle
면책사항
해당 정보와 게시물은 금융, 투자, 트레이딩 또는 기타 유형의 조언이나 권장 사항으로 간주되지 않으며, 트레이딩뷰에서 제공하거나 보증하는 것이 아닙니다. 자세한 내용은 이용 약관을 참조하세요.