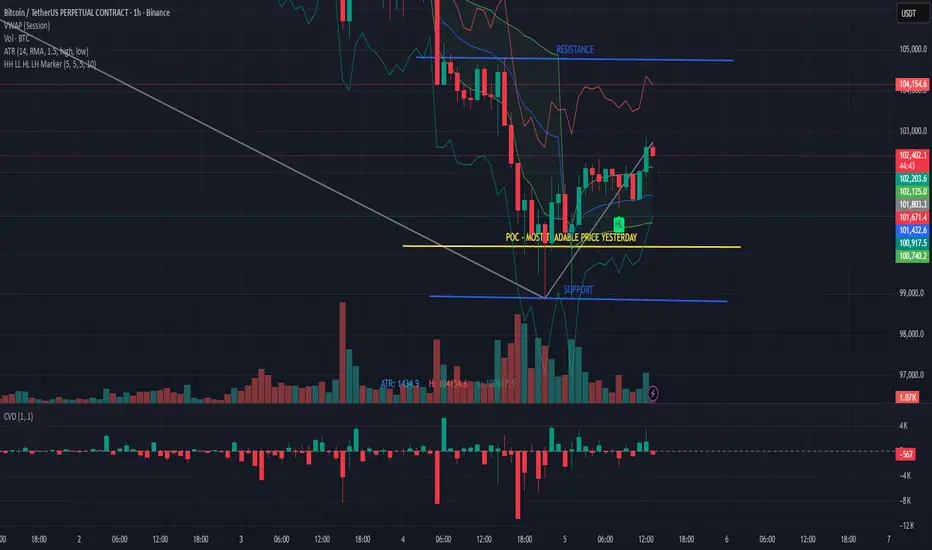
✅ What the chart is telling us
1) Strong Impulsive Down Move
Large bearish impulse candles
High selling volume
CVD deeply negative → aggressive sellers in control
Main trend is still down.
2) Reversal Reaction at Support Zone
At the local bottom we see:
Increased volume at lows ✔️
CVD flattening ✔️
Multiple failed breakdown attempts ✔️
This area shows buyers absorbing, shorts covering, and early longs stepping in.
3) First Higher Low (HL)
A Higher Low formed following a sharp drop.
✅ First sign of potential trend shift
❗Not a confirmed uptrend yet
To confirm a true reversal we need:
HL → done
HH → minor HH formed
Retest & hold → pending
So far this is only early recovery structure, not yet trend reversal confidence.
4) Key Level: POC + Value Area Low
Price is holding above yesterday’s POC — short-term bullish signal.
However, overhead we have:
Mid-range resistance
102.3–102.6 supply zone
Micro-value high cap
Price is pushing into resistance.
📊 1H Structure Summary
Element Status
Higher timeframe Downtrend
Current structure HL → minor HH
Volume Stabilizing
CVD Recovering (-9k → -380)
Location Retest of POC into supply
Bias Range → early accumulation signs
This is not a FOMO long spot.
This is a range recovery zone, not breakout continuation.
🎯 Trade Scenarios
🔥 Bullish scenario
Looking for:
Minor pullback
Hold 101.90–102.10
Break into 103,000 zone
Best long entry = HL retest after breakout, not here.
❄️ Bearish scenario
Short continuation if:
Price loses 101.90
Drops below Value Low
CVD flips down again
✅ Trader Game Plan
We do not chase here. Patience wins.
Looking for either:
Pullback to 1H demand + bounce → long scalp
Reject from 102.6 + LH on 5m → short continuation
Trade the reaction, not prediction.
Let the market show direction before committing.
📌 Conclusion
Buyers showed life — but still need to prove momentum.
Key levels
Bull defense: 102.0 – 101.9
Breakout confirmation: 102.6+
Bear continuation trigger: < 101.9
Now is the time to wait, not guess.
Patience ≠ weakness — it’s discipline.
면책사항
이 정보와 게시물은 TradingView에서 제공하거나 보증하는 금융, 투자, 거래 또는 기타 유형의 조언이나 권고 사항을 의미하거나 구성하지 않습니다. 자세한 내용은 이용 약관을 참고하세요.
면책사항
이 정보와 게시물은 TradingView에서 제공하거나 보증하는 금융, 투자, 거래 또는 기타 유형의 조언이나 권고 사항을 의미하거나 구성하지 않습니다. 자세한 내용은 이용 약관을 참고하세요.