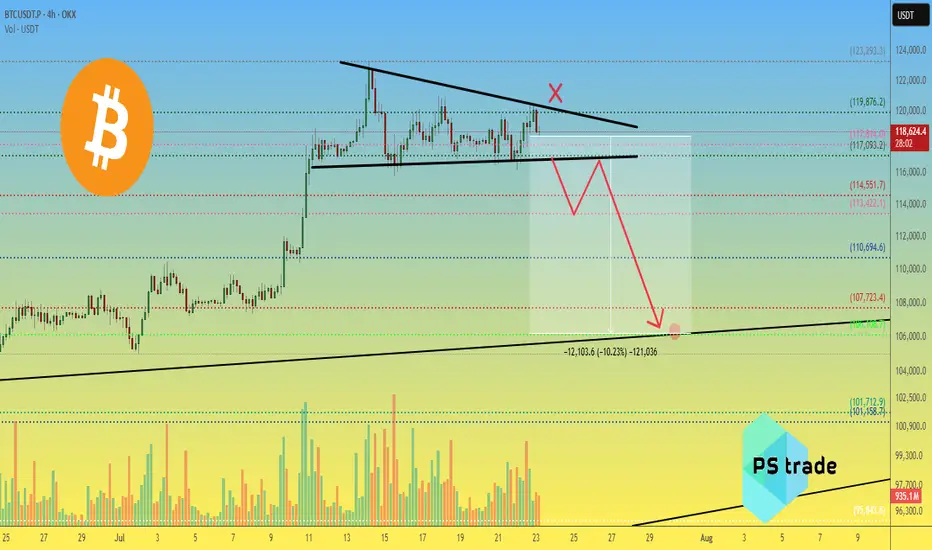
Price is being compressed under a descending trendline, and volume is steadily declining — a typical signal of an upcoming strong move.
📉 Downside target: $106,100 – $101,700
🔺 Invalidation: breakout above $119,876
📊 Key levels:
Resistance: $117000 / $113,500
Support: $110,694 / $107,723 / $106,108 / $101,712
⚠️ Pay attention — breakout is likely soon.
_____________________
Did you like our analysis? Leave a comment, like, and follow to get more
🎁 -20% for ALL trading fees at #OKX 👇
okx.com/join/20PSTRADE
🔥 V-I-P 👉 t.me/P_S_trade_menue_bot
🔵 Telegram 👉 t.me/pstrade_eng
🤖 Trading Bot 👉 copytrading.space/en/
📞 t.me/P_S_trades 📝
okx.com/join/20PSTRADE
🔥 V-I-P 👉 t.me/P_S_trade_menue_bot
🔵 Telegram 👉 t.me/pstrade_eng
🤖 Trading Bot 👉 copytrading.space/en/
📞 t.me/P_S_trades 📝
관련 발행물
면책사항
해당 정보와 게시물은 금융, 투자, 트레이딩 또는 기타 유형의 조언이나 권장 사항으로 간주되지 않으며, 트레이딩뷰에서 제공하거나 보증하는 것이 아닙니다. 자세한 내용은 이용 약관을 참조하세요.