Technical and Statistical Time-Series Analysis for Bitcoin (BTC)

Technical and Statistical Time-Series Analysis for Bitcoin (BTC) 📈
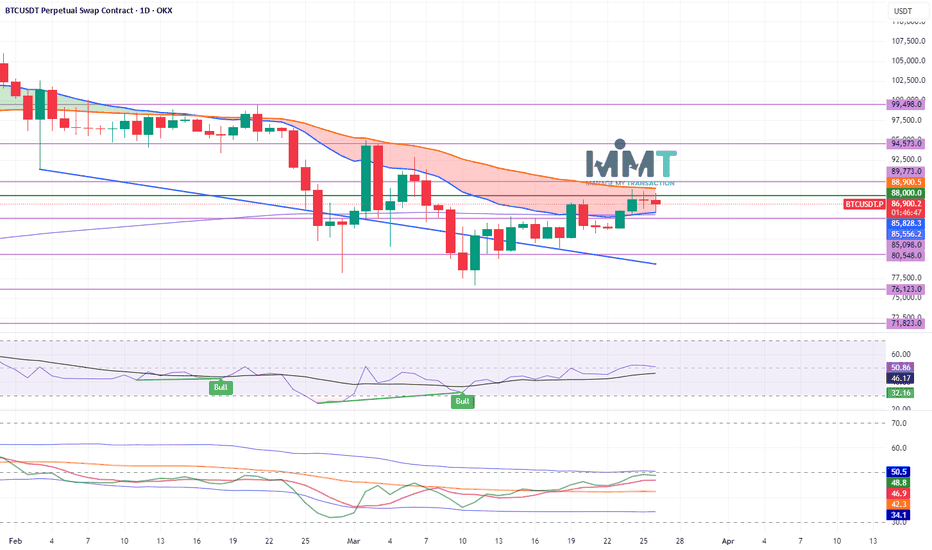
Bitcoin is currently trading around $82,000, having breached the critical support level at $80,548. This breakdown, combined with a potential daily close below this level, indicates a likelihood of accelerated downward momentum towards the corrective cycle's end target of $71,823. This target is anticipated to be reached within a short timeframe, between April 9th and 11th.
Price Movement Predictions: 🔮
March 30th - 31st:
A price rebound from $80,548 to $85,098 is expected, serving as a retest. Any rejection from the $85,098 range will signal a continuation of the corrective downtrend. 📉
March 31st - April 10th:
Continuation of the downward cycle is anticipated, targeting the following levels:
First Target: $76,123 🎯
Second Target: $71,823 🎯
April 11th or 12th:
A potential trend reversal towards a strong uptrend is foreseen. 🚀
Invalidation of the Scenario: ⚠️
This scenario will be invalidated if the price breaks above and closes above $90,000. This breakout and close, especially if sustained for three consecutive days, would signal the end of the correction and the resumption of the uptrend towards a new peak. 🔝
Notes: 📝
These predictions are based on technical analysis and do not constitute investment advice. 🚫
The cryptocurrency market is highly volatile, and trading involves significant risk. Proceed with caution. 🚨
It is very important to pay close attention to the economic market news, that can change any technical analysis. 📰
액티브 트레이드
You can See Previous Post to Understand what is going on now See Previous Post 👇🏻👇🏻👇🏻👇🏻👇🏻👇🏻
면책사항
이 정보와 게시물은 TradingView에서 제공하거나 보증하는 금융, 투자, 거래 또는 기타 유형의 조언이나 권고 사항을 의미하거나 구성하지 않습니다. 자세한 내용은 이용 약관을 참고하세요.
면책사항
이 정보와 게시물은 TradingView에서 제공하거나 보증하는 금융, 투자, 거래 또는 기타 유형의 조언이나 권고 사항을 의미하거나 구성하지 않습니다. 자세한 내용은 이용 약관을 참고하세요.