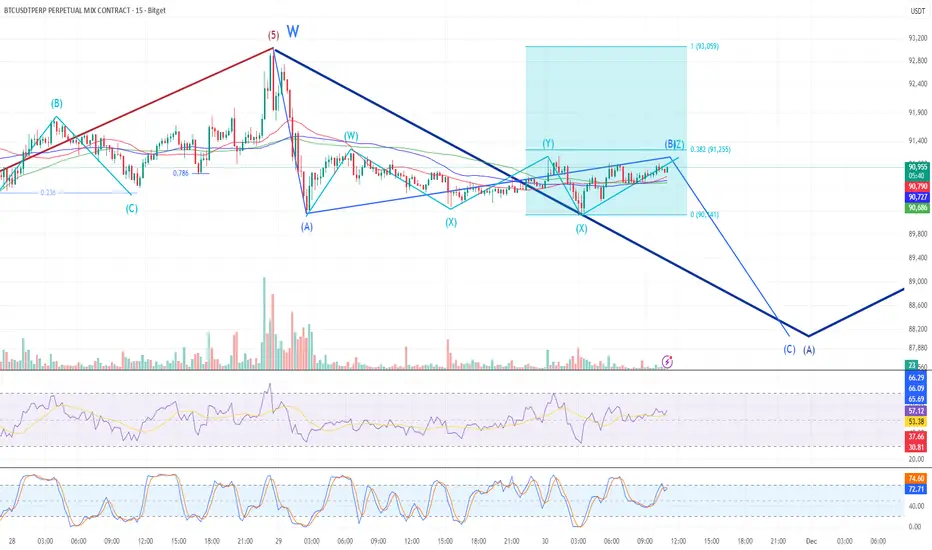
The higher timeframe ABC correction is being interpreted as a W-X-Y structure on the 15-minute chart, based on internal wave complexity.
Currently in the A wave of the internal ABC within the X leg
Within that A wave, a smaller ABC is unfolding, with the A-B portion nearing completion
Overall structure suggests a complex correction (W-X-Y-X-Z) in progress
At the moment, moving averages are tightly clustered, forming a combined support zone.
➡️ A clean break below this support cluster would strengthen the case for a Wave C move.
'규칙' & '패턴' 그리고 '조합'
blog.naver.com/lightvblue
blog.naver.com/lightvblue
면책사항
해당 정보와 게시물은 금융, 투자, 트레이딩 또는 기타 유형의 조언이나 권장 사항으로 간주되지 않으며, 트레이딩뷰에서 제공하거나 보증하는 것이 아닙니다. 자세한 내용은 이용 약관을 참조하세요.
'규칙' & '패턴' 그리고 '조합'
blog.naver.com/lightvblue
blog.naver.com/lightvblue
면책사항
해당 정보와 게시물은 금융, 투자, 트레이딩 또는 기타 유형의 조언이나 권장 사항으로 간주되지 않으며, 트레이딩뷰에서 제공하거나 보증하는 것이 아닙니다. 자세한 내용은 이용 약관을 참조하세요.