Based on mathematical and statistical models, along with technical tools such as Fibonacci retracement levels and moving averages, Bitcoin is currently undergoing a bearish correction after failing to break through the key resistance at $114,046.
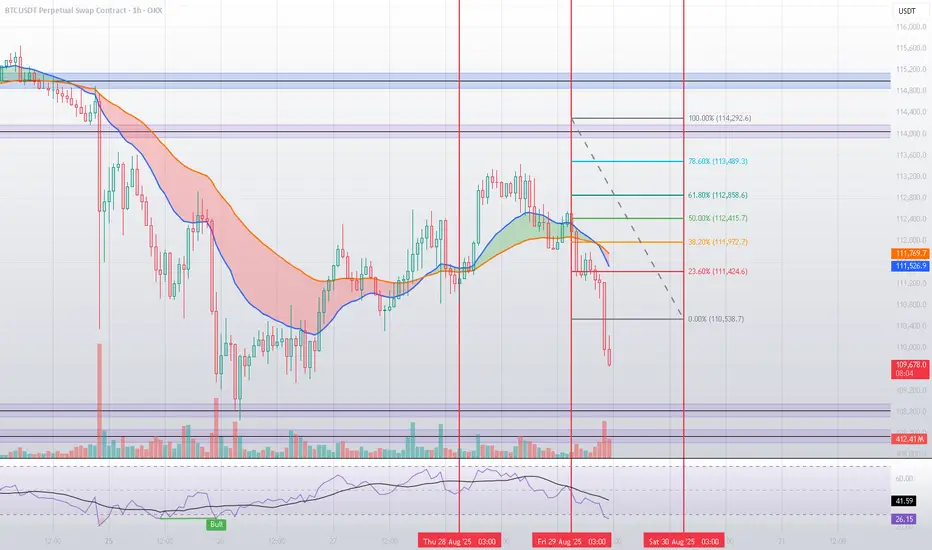
🔹 Interaction with Fibonacci Levels
In the previous analysis, we highlighted the importance of Fibonacci retracements in anticipating turning points. Recent price action confirmed this, as Bitcoin repeatedly reacted to these levels. The 61.8% retracement at $112,858 acted as a strong resistance, turning into a supply zone where sellers regained control.
Moreover, price failed to approach the 100% retracement at $114,292, reflecting a clear weakness in bullish momentum at higher levels. After that, Bitcoin broke below the 38.2% retracement at $111,972, triggering a sharper downside move — once again proving the reliability of statistical models in mapping market behavior ahead of time. 📉
🔹 Key Support Levels
$108,832: The first major support, aligning with a previous liquidity zone where price showed strong reactions. 🛡️
$108,353: A stronger support level. If broken, this could lead to a deeper bearish extension toward $107,500 or lower.
🔹 Technical Indicators
The RSI dropped to low levels (41.6 and even near 26.4 at certain points), signaling oversold conditions ⚠️, which may lead to a short-term rebound from the supports.
The 20 & 50 EMAs have crossed bearishly, confirming the downward bias.
🟢 Bullish Scenario
To regain momentum, Bitcoin must reclaim the $111,400 – $111,900 area and then retest the $112,800 (61.8% Fibonacci) level. Only a sustained breakout here would open the way toward the major resistance at $114,046. 🚀
🔴 Bearish Scenario
Failure to stabilize near current levels could push price down to $108,832, followed by $108,353. A breakdown below the latter would likely accelerate bearish momentum significantly.
✅ Conclusion
Bitcoin failed to reach the key resistance at $114,046 and gradually lost strength as it broke through crucial Fibonacci levels. The market is now testing critical supports at $108,832 and $108,353, which will determine whether a rebound is possible or if further downside is ahead. At this stage, caution is essential ⚖️, with close monitoring of liquidity and momentum.
액티브 트레이드
SOOOON WE WILL SEE BTC : 104024.9 🙃🙃면책사항
이 정보와 게시물은 TradingView에서 제공하거나 보증하는 금융, 투자, 거래 또는 기타 유형의 조언이나 권고 사항을 의미하거나 구성하지 않습니다. 자세한 내용은 이용 약관을 참고하세요.
면책사항
이 정보와 게시물은 TradingView에서 제공하거나 보증하는 금융, 투자, 거래 또는 기타 유형의 조언이나 권고 사항을 의미하거나 구성하지 않습니다. 자세한 내용은 이용 약관을 참고하세요.