BTC coiling within daily triangle at 112k – watch 110k support a
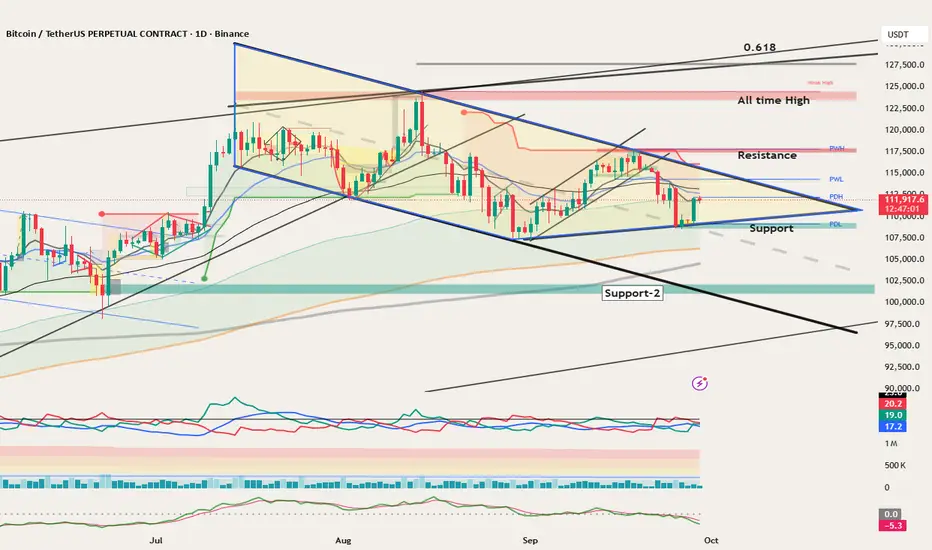
BTC/USDT daily chart shows price compressing inside a large symmetrical triangle, trading near $112K. With upcoming catalysts (NFP Oct 3, CPI Oct 15, FOMC Oct 28–29), the next breakout could set the trend.
BTC has formed lower highs since July and higher lows since June, creating a wedge. Recent support is at 108,723, with deeper support near 101,000. Resistance is at 117,711, with higher targets near 124K–126K. A breakout above 117,711 opens the way toward 128,000, while a breakdown below support risks a slide toward 101,000. EMAs are clustered, momentum is neutral, and volume is fading.
Trade Plan:
Long Setup: Break and daily close above 117,711 → enter on retest; stops below 110K. Targets: 124K–126K, extension to 128K.
Short Setup: Breakdown below 108,723 → short on retest; stops above 114K. Targets: 106K and 101K.
Takeaway:
BTC is coiling tightly within the triangle. With critical macro data ahead, a clean break beyond 117,711 or below 108,723 will likely decide the next leg.
Disclaimer: Educational content only, not financial advice.
A Haque
Founder | MyTradingJournal
📊 Financial Market Analyst | Trader | Educator
Founder | MyTradingJournal
📊 Financial Market Analyst | Trader | Educator
면책사항
이 정보와 게시물은 TradingView에서 제공하거나 보증하는 금융, 투자, 거래 또는 기타 유형의 조언이나 권고 사항을 의미하거나 구성하지 않습니다. 자세한 내용은 이용 약관을 참고하세요.
A Haque
Founder | MyTradingJournal
📊 Financial Market Analyst | Trader | Educator
Founder | MyTradingJournal
📊 Financial Market Analyst | Trader | Educator
면책사항
이 정보와 게시물은 TradingView에서 제공하거나 보증하는 금융, 투자, 거래 또는 기타 유형의 조언이나 권고 사항을 의미하거나 구성하지 않습니다. 자세한 내용은 이용 약관을 참고하세요.