Support and Resistance Levels:
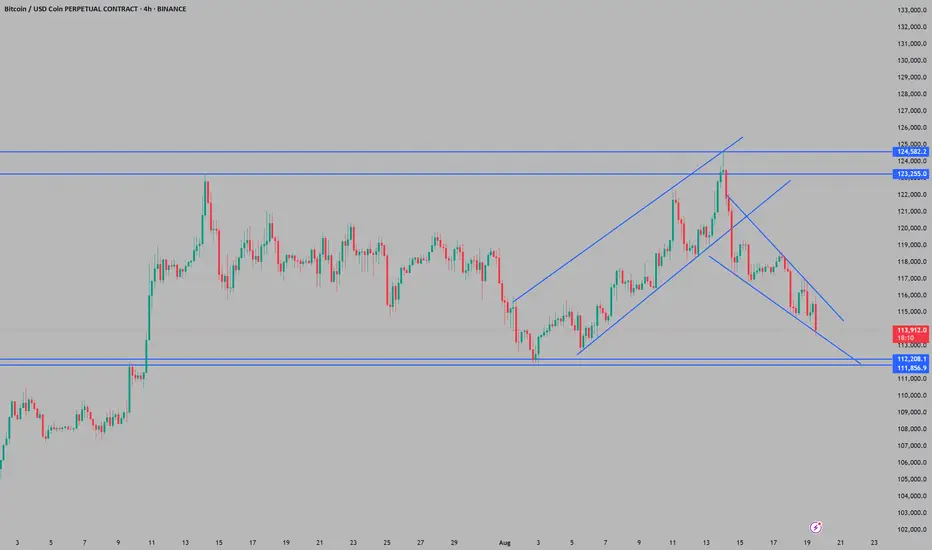
Major support appears to be around 111k–112k, which has held previously after a strong upward move.
Resistance levels marked at 123k and 124k indicate prior highs and significant selling pressure.
Price Action & Structure:
The price recently had formed an ascending channel, which was broken to the downside, suggesting the bullish momentum has faded.
Currently, price is inside a descending channel, moving lower after the recent drop from the highs. This typically indicates continued bearish pressure in the short term.
Trend:
With the breakdown of the ascending channel and price forming lower highs and lower lows, the short-term trend is bearish.
The price is approaching the major support zone (near 112,000). If this holds, a bounce is possible; if it breaks, further downside could occur.
Outlook:
Bearish bias short-term: Price is trending downward inside the channel.
Key zones to watch: The 111k–112k area for support. Bulls need to defend this level; failure likely leads to deeper corrections.
If the price recovers and breaks above the descending channel, it would be the first sign of potential reversal or consolidation.
Summary
Right now, Bitcoin’s 4H chart suggests weakness, with sellers in control short-term. Watch for reactions at the 111-112k zone—this will likely decide the next directional move. Bulls have to defend this area, or further decline is likely. Bulls should wait for signs of strength or a channel breakout before re-entering aggressively.
면책사항
해당 정보와 게시물은 금융, 투자, 트레이딩 또는 기타 유형의 조언이나 권장 사항으로 간주되지 않으며, 트레이딩뷰에서 제공하거나 보증하는 것이 아닙니다. 자세한 내용은 이용 약관을 참조하세요.
면책사항
해당 정보와 게시물은 금융, 투자, 트레이딩 또는 기타 유형의 조언이나 권장 사항으로 간주되지 않으며, 트레이딩뷰에서 제공하거나 보증하는 것이 아닙니다. 자세한 내용은 이용 약관을 참조하세요.