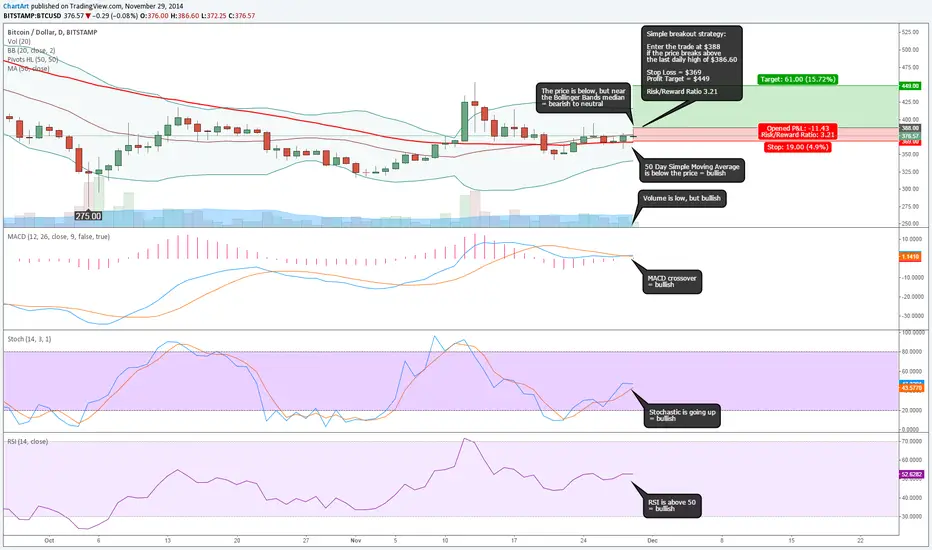
As explained on the chart the goal of this breakout strategy is to avoid risk and therefore the trade should only be entered if the price breaks above the last high of $386.60 on Bitstamp, because this is the last and most important signal to confirm a new uptrend. (Please zoom in to better see the candlesticks).
Maybe this chart helps new people who are starting with trading to see the overall Bitcoin price trend. I researched what the most common day-trading indicators are and wanted to share with you what these show with default settings. The most popular indicators are the MACD, Stochastic and RSI (Relative Strength Index). The Moving Average wasn't mentioned as being the most popular, but I know it's a popular indicator, especially with the classic 50 day period.
Maybe this chart helps new people who are starting with trading to see the overall Bitcoin price trend. I researched what the most common day-trading indicators are and wanted to share with you what these show with default settings. The most popular indicators are the MACD, Stochastic and RSI (Relative Strength Index). The Moving Average wasn't mentioned as being the most popular, but I know it's a popular indicator, especially with the classic 50 day period.
관련 발행물
면책사항
해당 정보와 게시물은 금융, 투자, 트레이딩 또는 기타 유형의 조언이나 권장 사항으로 간주되지 않으며, 트레이딩뷰에서 제공하거나 보증하는 것이 아닙니다. 자세한 내용은 이용 약관을 참조하세요.
관련 발행물
면책사항
해당 정보와 게시물은 금융, 투자, 트레이딩 또는 기타 유형의 조언이나 권장 사항으로 간주되지 않으며, 트레이딩뷰에서 제공하거나 보증하는 것이 아닙니다. 자세한 내용은 이용 약관을 참조하세요.