Posting as example in real time of a quick and easy measure.
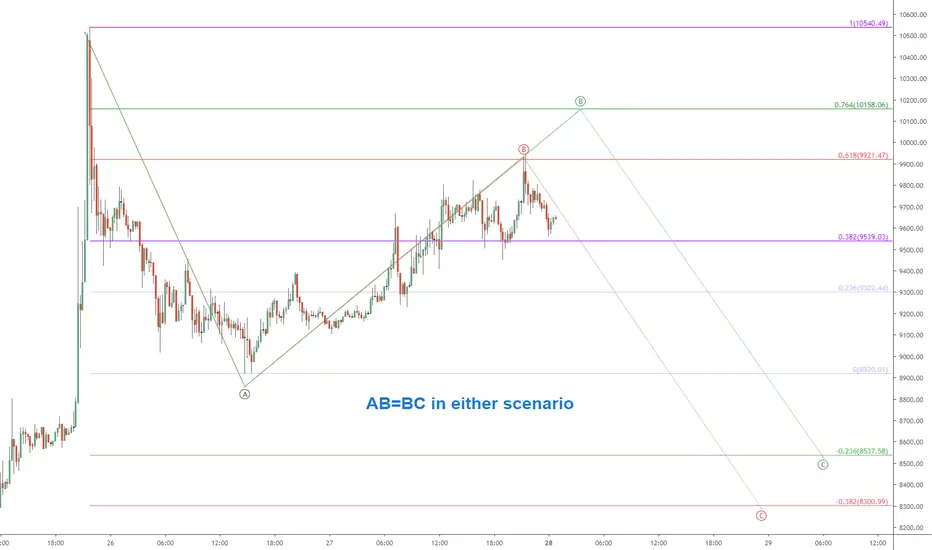
This plot shows two possible pathways of an "ABC Correction".
Both options map an AB=BC (equal legs) move that is common.
The above chart uses TV's "Fibonacci Retracement" tool.
After placing the fib, I go into its "Settings" and make changes:
- un-checked the "Background" option (thus no coloration)
- un-checked many of the levels (and added some of my own)
- Changed the color of some levels (to pair the red and green ones)
The Fibonacci Retracement tool can be used as a custom Ruler.
You can set ANY ratios/increments, say (.25/.50/.75) or (.1/.2/.../.9)
You can set "Retracement" (+) as well as "Extension" (-) levels as needed.
Normally I use multiple such Fibs to map the bigger picture.
But this simple example occurs in all assets in all time frames.
Also, which level it reaches says something of the strength of move.
the Golden Ratio is my Religion
the Trading View is my Nation
the Moderator Tag is my Flag
the Trading View is my Nation
the Moderator Tag is my Flag
면책사항
이 정보와 게시물은 TradingView에서 제공하거나 보증하는 금융, 투자, 거래 또는 기타 유형의 조언이나 권고 사항을 의미하거나 구성하지 않습니다. 자세한 내용은 이용 약관을 참고하세요.
면책사항
이 정보와 게시물은 TradingView에서 제공하거나 보증하는 금융, 투자, 거래 또는 기타 유형의 조언이나 권고 사항을 의미하거나 구성하지 않습니다. 자세한 내용은 이용 약관을 참고하세요.