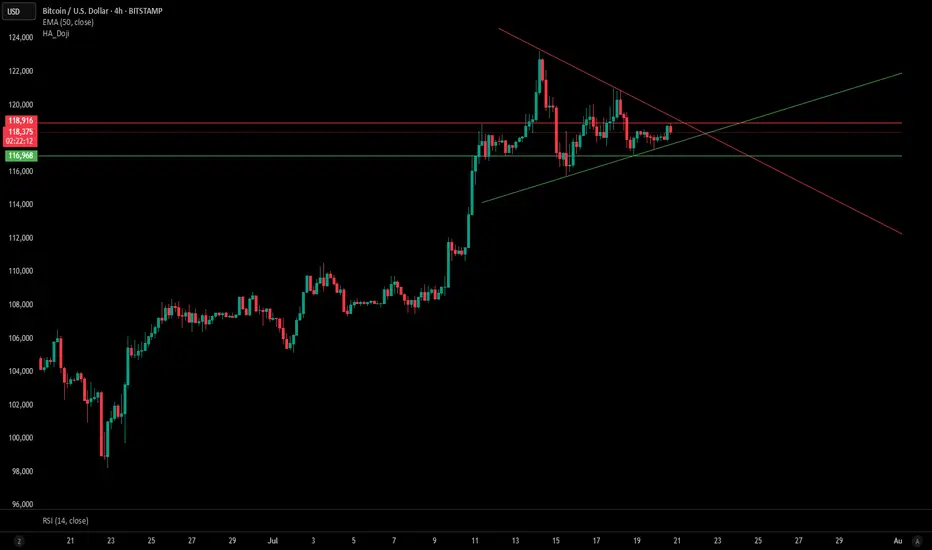
Bitcoin is currently consolidating within a symmetrical triangle pattern on the 4H chart, with both trendlines converging toward a decision point. Price is hovering just below the resistance line (~$118,900) and holding above key support at ~$116,968.
📊 Key Levels:
Resistance: $118,916 (triangle top / horizontal resistance)
Support: $116,968 (horizontal support)
EMA 50 (4H): $117,550 – currently acting as dynamic support
📉 RSI (14): Hovering near 50, indicating neutral momentum — awaiting confirmation of breakout direction.
A breakout above the descending trendline could trigger bullish momentum, while a break below the rising support may indicate further downside. Watch for volume confirmation on the breakout.
면책사항
이 정보와 게시물은 TradingView에서 제공하거나 보증하는 금융, 투자, 거래 또는 기타 유형의 조언이나 권고 사항을 의미하거나 구성하지 않습니다. 자세한 내용은 이용 약관을 참고하세요.
면책사항
이 정보와 게시물은 TradingView에서 제공하거나 보증하는 금융, 투자, 거래 또는 기타 유형의 조언이나 권고 사항을 의미하거나 구성하지 않습니다. 자세한 내용은 이용 약관을 참고하세요.