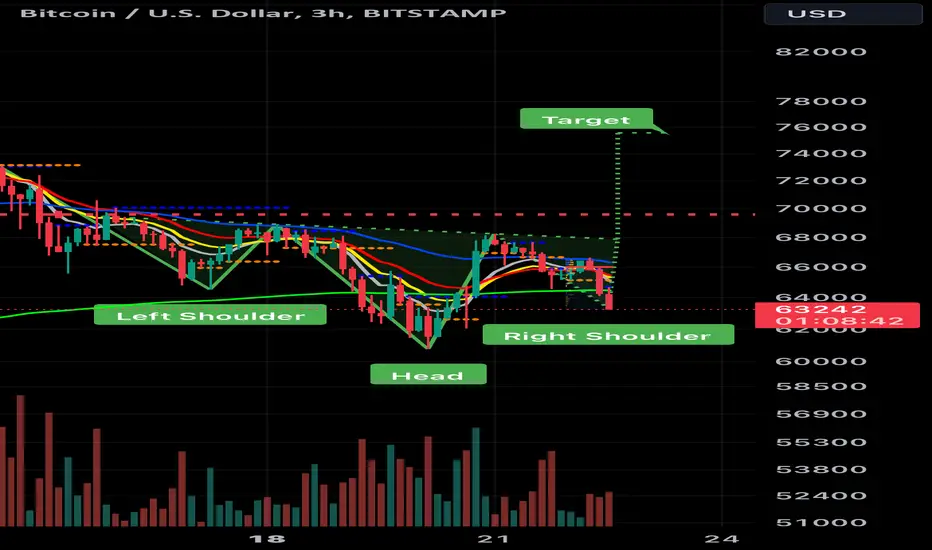
The BTC/USD 3-hour chart suggests a potential inverted head and shoulders pattern, indicating a possible bullish reversal.
Conversely, the daily chart hints at a head and shoulders pattern, suggesting a potential bearish trend. This contradiction creates uncertainty.
The presence of both an inverted head and shoulders (bullish) on the 3-hour chart and a head and shoulders (bearish) on the daily chart creates ambiguity. This is a classic example of a confluence issue in technical analysis.
The inverted head and shoulders could be a fakeout, a deceptive pattern that lures investors into buying before reversing course.
The market might be consolidating before a more definitive breakout in either direction.
액티브 트레이드
노트
As long as btc can hold the 200 ema it looks probable.액티브 트레이드
노트
노트
Not a bad R:R. 69k is strong resistance but if anything can break it bitcoin can.노트
노트
Lots of resistance on the way. I’m better off with no stops these days.노트
노트
노트
Nice set up overall.노트
노트
Pennant formed within the larger trend.액티브 트레이드
노트
노트
Here is the original set up.노트
노트
Classic fake out to shake out the over leveraged traders액티브 트레이드
노트
How many people shorted this? Raise your hand.노트
노트
Sideways for now.액티브 트레이드
노트
Let’s see how this small pennant reacts to a break out.노트
액티브 트레이드
Still on track for new ATH. Never in a straight line.노트
액티브 트레이드
노트
노트
Never lose sight never use too much leverage노트
USDT: 0xd3787d843Cf915E5475119459B34b6429827c297
면책사항
이 정보와 게시물은 TradingView에서 제공하거나 보증하는 금융, 투자, 거래 또는 기타 유형의 조언이나 권고 사항을 의미하거나 구성하지 않습니다. 자세한 내용은 이용 약관을 참고하세요.
USDT: 0xd3787d843Cf915E5475119459B34b6429827c297
면책사항
이 정보와 게시물은 TradingView에서 제공하거나 보증하는 금융, 투자, 거래 또는 기타 유형의 조언이나 권고 사항을 의미하거나 구성하지 않습니다. 자세한 내용은 이용 약관을 참고하세요.