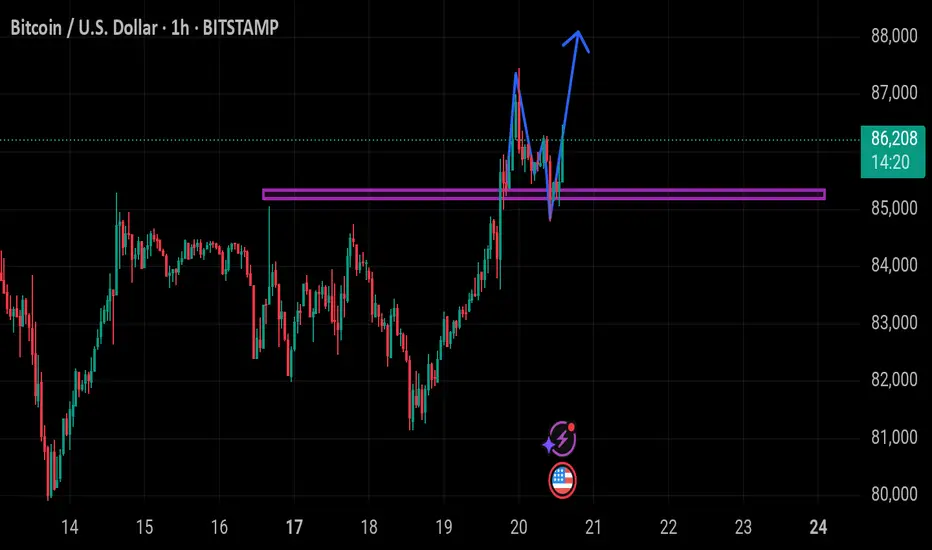
This is a Bitcoin (BTC/USD) price chart on the 1-hour timeframe from TradingView. The price is currently at $86,278, down -0.68%.
Key Observations:
1. Support Zone (Purple Line): A strong horizontal support/resistance level is drawn around $85,000.
2. Breakout & Retest: The price recently broke above this support zone, retested it, and bounced back up.
3. Bullish Projection (Blue Arrow): A potential bullish move is indicated, suggesting further upside momentum.
This chart suggests a possible continuation of the uptrend if the support holds. Let me know if you need further analysis!
면책사항
이 정보와 게시물은 TradingView에서 제공하거나 보증하는 금융, 투자, 거래 또는 기타 유형의 조언이나 권고 사항을 의미하거나 구성하지 않습니다. 자세한 내용은 이용 약관을 참고하세요.
면책사항
이 정보와 게시물은 TradingView에서 제공하거나 보증하는 금융, 투자, 거래 또는 기타 유형의 조언이나 권고 사항을 의미하거나 구성하지 않습니다. 자세한 내용은 이용 약관을 참고하세요.