https://www.tradingview.com/x/S3xhWLRG/
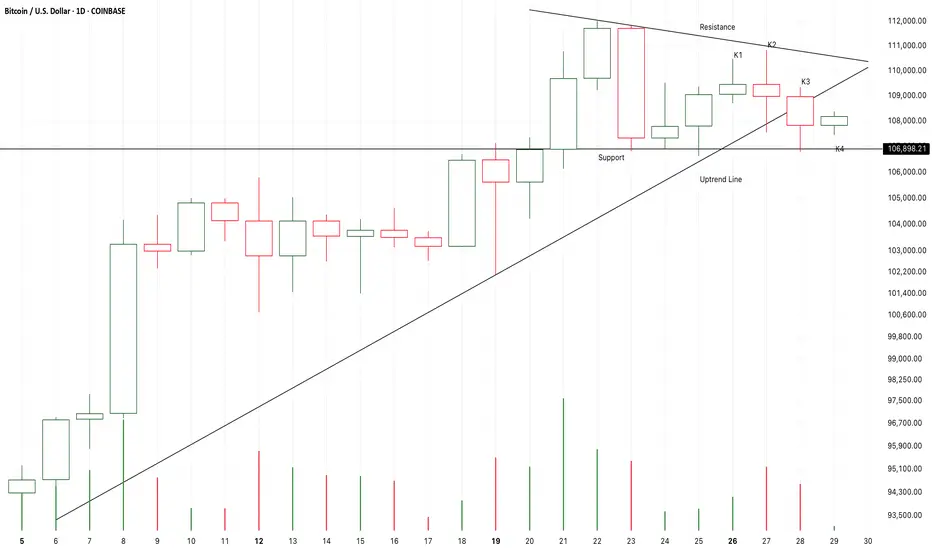
K3 is a weak break down,
It failed to close below K2.
It seems that K4 will test the uptrend line to verify K3 was a fake down or not.
If K4 close upon K3,
Another bull run will start here to test 112K area.
If K4 or K5 are doji candles around the support,
It is likely that a sharp price correction will start here to test 102K area.
노트
K5 and K6 are two bullish candles,
It seems that K6 will close upon or near the resistance.
The supply pressure keeps decreasing.
All of this are good signals for the bull market.
On the other hand,
The candle body of K6 is still too small,
It couldn’t verify the strong bullish momentum,
K7 must accelerate to break up to verify the strong market,
If not,
I will expecte a 3-4 weeks consolidation around the resisitance and then break up to test 120K area.
I don’t think it is a good idea to short it here with heavy positions.
Perhaps after two months,
The three years bull market will get to its time limit.
면책사항
이 정보와 게시물은 TradingView에서 제공하거나 보증하는 금융, 투자, 거래 또는 기타 유형의 조언이나 권고 사항을 의미하거나 구성하지 않습니다. 자세한 내용은 이용 약관을 참고하세요.
면책사항
이 정보와 게시물은 TradingView에서 제공하거나 보증하는 금융, 투자, 거래 또는 기타 유형의 조언이나 권고 사항을 의미하거나 구성하지 않습니다. 자세한 내용은 이용 약관을 참고하세요.