Statistics / stochastic processes fascinate me and the above statistic is worthy of some attention.
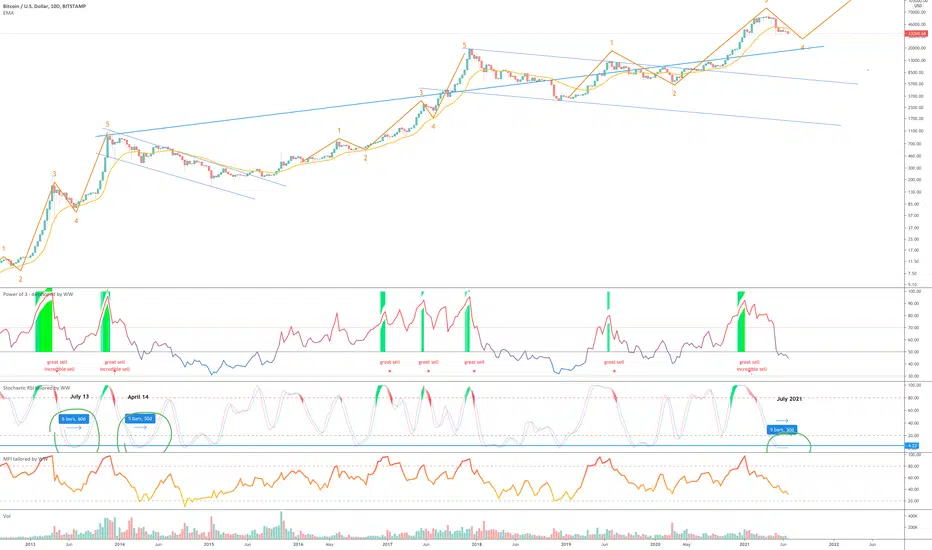
In case you’re not familiar with Stochastic RSI, it is a ‘oscillator’ (circled in green) of the RSI oscillator. You read that correctly, an oscillator of an oscillator. Therefore it naturally lags the RSI measurement.
The Stochastic RSI oscillator is there to do one thing, measure momentum. The range of measured momentum is between 0 and 100. Typically anything > 80 is overbought and anything <20 is oversold.
Read the title again. Currently Stochastic RSI on the above 10-day chart is sitting on 0.99, which is equal to a fire sale.
Has Stochastic RSI been here before? Yes.
Looking left - the only two other times in **all** of Bitcoin’s history Stochastic RSI was this low was back in 2013 during the months of July and the following April. The length of each condition was 60 and 50 days respectively.
Now look again at the top chart, over sold for 50 days @ 0.99.
I’m not suggesting we’re going to see the types of return we saw in the past, but what I will suggest is something explosive is about to happen to price action. How do I know? Look left ;)
Ignore the FeAr!
WW
노트
Now approaching 70 days! A new record.면책사항
이 정보와 게시물은 TradingView에서 제공하거나 보증하는 금융, 투자, 거래 또는 기타 유형의 조언이나 권고 사항을 의미하거나 구성하지 않습니다. 자세한 내용은 이용 약관을 참고하세요.
면책사항
이 정보와 게시물은 TradingView에서 제공하거나 보증하는 금융, 투자, 거래 또는 기타 유형의 조언이나 권고 사항을 의미하거나 구성하지 않습니다. 자세한 내용은 이용 약관을 참고하세요.