#BTC (Update)
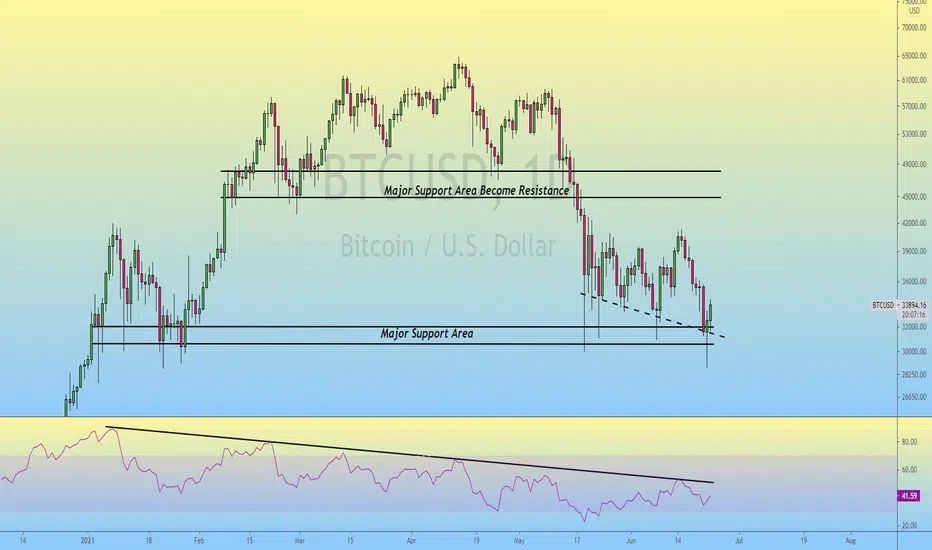
In Daily timeframe Chart, Death Cross Already Confirmed But Bitcoin is Still Moving Above the Crucial Support (31k)..
RSI indicator is Making Lower Highs Since 8th Jan (Downtrend).
Bulls Defending the Support & Looking Strong & Buying the DIP 😊
Buy at the Support & Sell at Resistance, Right??

RSI Printing Bullish Divergence in Daily timeframe Chart & Bitcoin Might Test the 40k Area..!!

In Weekly timeframe, Bitcoin is Still Moving Above the Major Trendline & EMA50 (33780) 🏄♂️
If Bitcoin Remains Above the Trendline & EMA50, Bitcoin Might Retest the 60k Major Resistance Area 📈
If Bitcoin Bulls Lost the Trendline & EMA50 Support then Next Stop Could be 20k (Psychological Support Area)
Please like the idea for Support & Subscribe for More ideas like this and share your ideas and charts in Comments Section..!!
Thanks for Your Love & Support..!!
In Daily timeframe Chart, Death Cross Already Confirmed But Bitcoin is Still Moving Above the Crucial Support (31k)..
RSI indicator is Making Lower Highs Since 8th Jan (Downtrend).
Bulls Defending the Support & Looking Strong & Buying the DIP 😊
Buy at the Support & Sell at Resistance, Right??
RSI Printing Bullish Divergence in Daily timeframe Chart & Bitcoin Might Test the 40k Area..!!
In Weekly timeframe, Bitcoin is Still Moving Above the Major Trendline & EMA50 (33780) 🏄♂️
If Bitcoin Remains Above the Trendline & EMA50, Bitcoin Might Retest the 60k Major Resistance Area 📈
If Bitcoin Bulls Lost the Trendline & EMA50 Support then Next Stop Could be 20k (Psychological Support Area)
Please like the idea for Support & Subscribe for More ideas like this and share your ideas and charts in Comments Section..!!
Thanks for Your Love & Support..!!
면책사항
이 정보와 게시물은 TradingView에서 제공하거나 보증하는 금융, 투자, 거래 또는 기타 유형의 조언이나 권고 사항을 의미하거나 구성하지 않습니다. 자세한 내용은 이용 약관을 참고하세요.
면책사항
이 정보와 게시물은 TradingView에서 제공하거나 보증하는 금융, 투자, 거래 또는 기타 유형의 조언이나 권고 사항을 의미하거나 구성하지 않습니다. 자세한 내용은 이용 약관을 참고하세요.