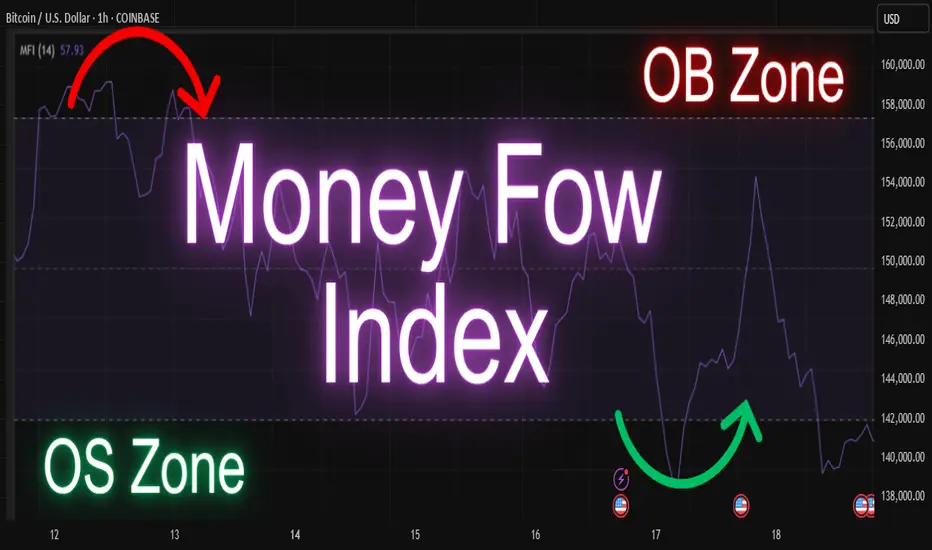
the money flow index (mfi) is a momentum indicator that uses both price and volume to measure buying and selling pressure
🧠 unlike rsi, which only considers price, mfi gives deeper insights by combining volume into the calculation
mfi values range from 0 to 100
1)above 80 = overbought zone

2)below 20 = oversold zone

🔍 traders use mfi to spot potential reversals, divergences, and to confirm trends
🛠️ you can combine mfi with other indicators like moving averages or support/resistance for better decision-making
🧪 test it on different timeframes to understand how it behaves with your strategy
Disclaimer :
This idea post is not financial advice, it's for educational purposes only, I am not a SEBI-registered advisor. Trading and investing involve risk, and you should consult with a qualified financial advisor before making any trading decisions. I do not guarantee profits or take responsibility for any losses you may incur.
🧠 unlike rsi, which only considers price, mfi gives deeper insights by combining volume into the calculation
mfi values range from 0 to 100
1)above 80 = overbought zone
2)below 20 = oversold zone
🔍 traders use mfi to spot potential reversals, divergences, and to confirm trends
🛠️ you can combine mfi with other indicators like moving averages or support/resistance for better decision-making
🧪 test it on different timeframes to understand how it behaves with your strategy
Disclaimer :
This idea post is not financial advice, it's for educational purposes only, I am not a SEBI-registered advisor. Trading and investing involve risk, and you should consult with a qualified financial advisor before making any trading decisions. I do not guarantee profits or take responsibility for any losses you may incur.
Shivam mandai
면책사항
해당 정보와 게시물은 금융, 투자, 트레이딩 또는 기타 유형의 조언이나 권장 사항으로 간주되지 않으며, 트레이딩뷰에서 제공하거나 보증하는 것이 아닙니다. 자세한 내용은 이용 약관을 참조하세요.
Shivam mandai
면책사항
해당 정보와 게시물은 금융, 투자, 트레이딩 또는 기타 유형의 조언이나 권장 사항으로 간주되지 않으며, 트레이딩뷰에서 제공하거나 보증하는 것이 아닙니다. 자세한 내용은 이용 약관을 참조하세요.