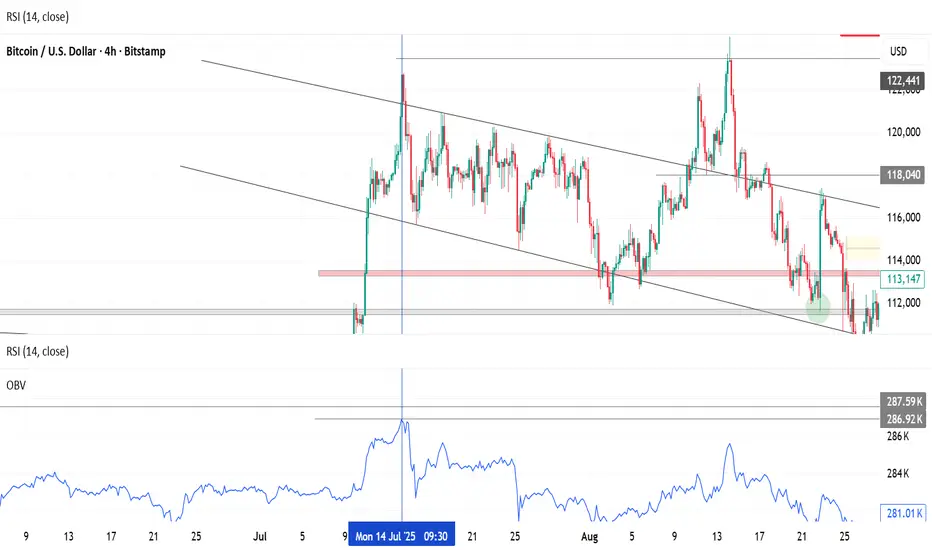
This 4-hour chart of Bitcoin (BTC/USD) highlights a breakout from a descending channel after a prolonged consolidation phase lasting over 16 days (99 bars).
🔻 A clearly defined supply zone (marked in red) acted as a major resistance area, rejecting price multiple times before the breakout. The breakout above this zone indicates a shift in market structure, with bullish momentum gaining strength.
🟡 The breakout was followed by sustained buying pressure, pushing BTC upwards toward the $118,000 region. Price has since pulled back slightly and is now hovering around $115,500 — retesting the previous resistance zone, now potentially acting as support
면책사항
이 정보와 게시물은 TradingView에서 제공하거나 보증하는 금융, 투자, 거래 또는 기타 유형의 조언이나 권고 사항을 의미하거나 구성하지 않습니다. 자세한 내용은 이용 약관을 참고하세요.
면책사항
이 정보와 게시물은 TradingView에서 제공하거나 보증하는 금융, 투자, 거래 또는 기타 유형의 조언이나 권고 사항을 의미하거나 구성하지 않습니다. 자세한 내용은 이용 약관을 참고하세요.