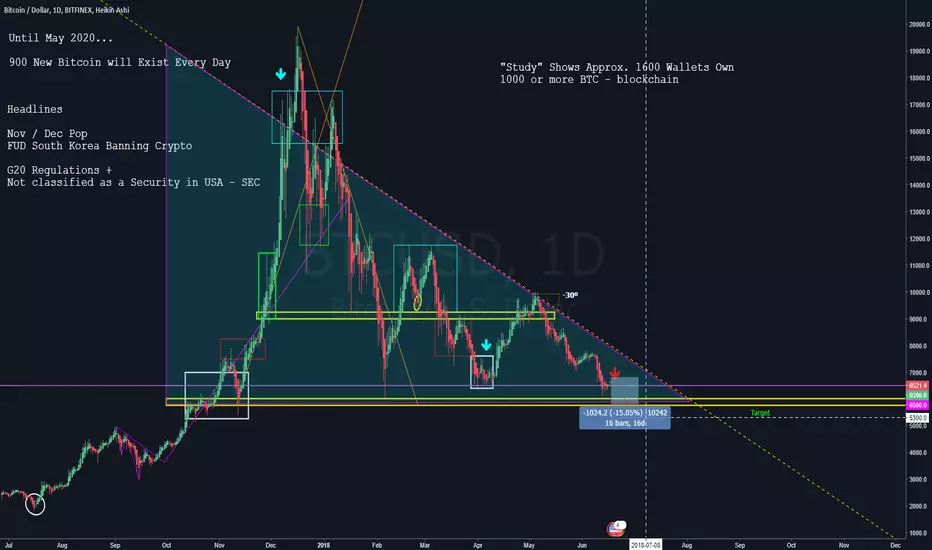
Here we can observe a Triangle Formation with many large Bearish candlesticks and occasional high volatility causes price to swing up to psychological areas on the chart.
Detailed Description to be created June 19
I appreciate you like this Technical Analysis!
I am not a Financial Advisor and you must accept full responsibility for any investment decisions you make with real money... Practice
Detailed Description to be created June 19
I appreciate you like this Technical Analysis!
I am not a Financial Advisor and you must accept full responsibility for any investment decisions you make with real money... Practice
면책사항
해당 정보와 게시물은 금융, 투자, 트레이딩 또는 기타 유형의 조언이나 권장 사항으로 간주되지 않으며, 트레이딩뷰에서 제공하거나 보증하는 것이 아닙니다. 자세한 내용은 이용 약관을 참조하세요.
면책사항
해당 정보와 게시물은 금융, 투자, 트레이딩 또는 기타 유형의 조언이나 권장 사항으로 간주되지 않으며, 트레이딩뷰에서 제공하거나 보증하는 것이 아닙니다. 자세한 내용은 이용 약관을 참조하세요.