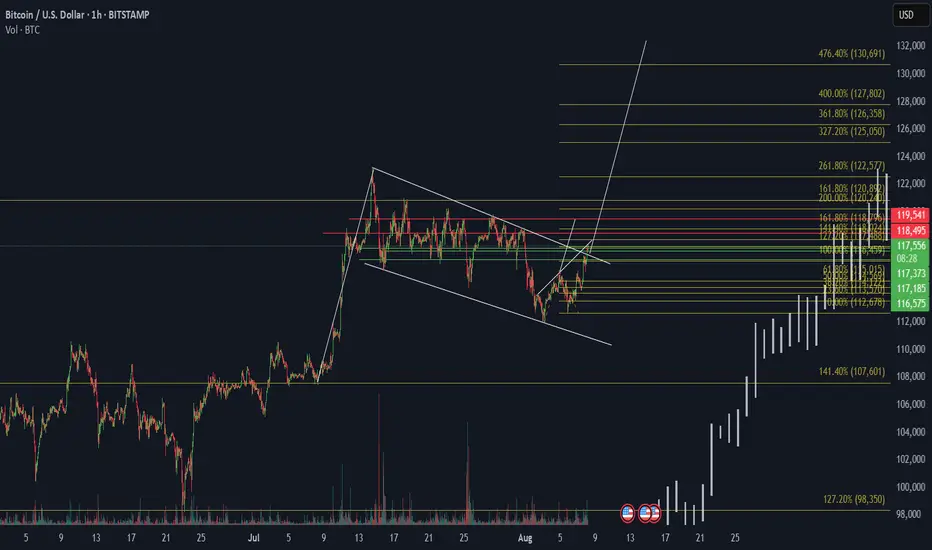
Technical Highlights:
Pattern Breakout: BTC has broken out of a descending wedge, a bullish reversal pattern.
Fibonacci Extensions: The price projection levels are drawn from the recent swing low to high:
1.618 (161.8%) 120,892
2.618 (261.8%) 122,577
3.618 (361.8%) 126,358
4.764 (476.4%) 130,691 = Target Area
Volume: A noticeable volume spike supports the breakout.
Current Price: Around 117,225 reclaiming above key resistance levels.
Bullish Confirmation Levels:
117,373 (Previous resistance now acting as support)
118,495 and 119,541 Strong horizontal resistance to clear
Sustained close above 120K could lead to a parabolic move toward 130K+
면책사항
이 정보와 게시물은 TradingView에서 제공하거나 보증하는 금융, 투자, 거래 또는 기타 유형의 조언이나 권고 사항을 의미하거나 구성하지 않습니다. 자세한 내용은 이용 약관을 참고하세요.
면책사항
이 정보와 게시물은 TradingView에서 제공하거나 보증하는 금융, 투자, 거래 또는 기타 유형의 조언이나 권고 사항을 의미하거나 구성하지 않습니다. 자세한 내용은 이용 약관을 참고하세요.