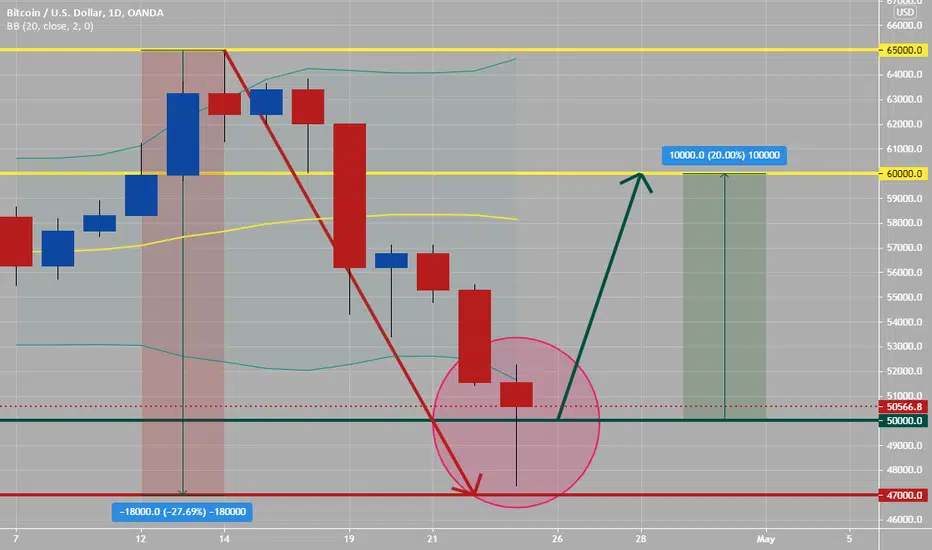
BTCUSD daily had made a hammer on Friday after a $18,000 drop within the last two weeks in price action.
The hammer puts in its appearance after prolonged downtrend. On the day of the hammer candle, there is strong selling, often beginning at the opening bell. As the day goes on, however, the market recovers and closes near the unchanged mark, or in some cased even higher. In these cases the market potentially is “hammering” out a bottom.
In order for the Hammer signal to be valid, the following conditions must exist:
• BTCUSD must have been in a definite downtrend before this signal occurs. This can be visually seen on the chart.
• The lower shadow must be at least twice the size of the body.
• The day after the Hammer is formed, one should witness continued buying. * I except buying after BTCUSD opens, related to huge drop in price action of late and the formation of this daily hammer on Friday. (Note) I do not trade this, but follow it in relation to affects on Forex pairs, gold, oil..etc...
• There should be no upper shadow or a very small upper shadow. The color of the body does not matter, but a white body would be more positive than a black body.
I except last week of April to be bullish for BTCUSD and might go up $10,000 or to 60,000 level noted on chart. Good luck and use risk management always.
액티브 트레이드
trade is still going right direction, still looking at 60,000 by end of week for target.주문취소됨
Right is evaluation last week, with PA almost going back up to $60K, still might happen...soon. but this was just and idea.. gl면책사항
이 정보와 게시물은 TradingView에서 제공하거나 보증하는 금융, 투자, 거래 또는 기타 유형의 조언이나 권고 사항을 의미하거나 구성하지 않습니다. 자세한 내용은 이용 약관을 참고하세요.
면책사항
이 정보와 게시물은 TradingView에서 제공하거나 보증하는 금융, 투자, 거래 또는 기타 유형의 조언이나 권고 사항을 의미하거나 구성하지 않습니다. 자세한 내용은 이용 약관을 참고하세요.