Bitcoin – Long-Term View with Elliott Wave Structure
Hello traders,
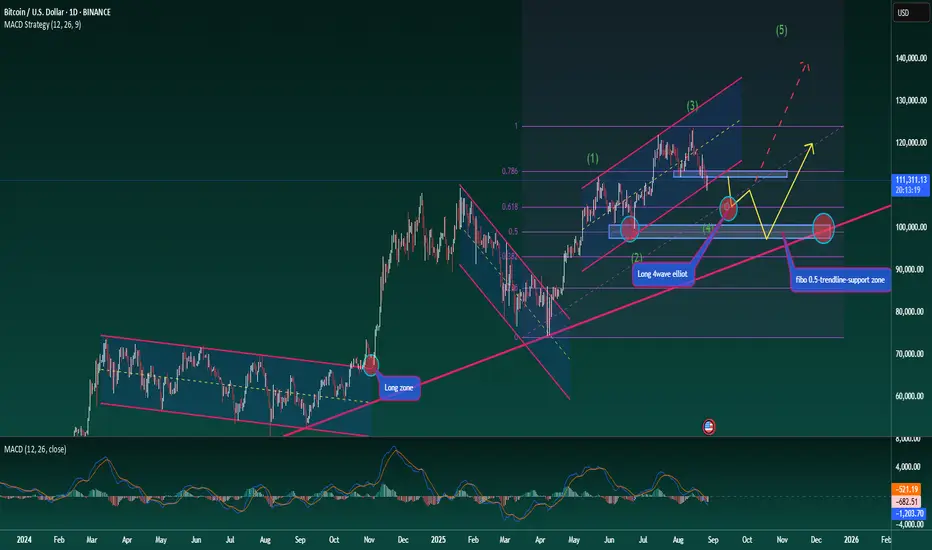
Let’s take a medium- to long-term look at BTC. The broader trend is clearly bullish, but for any uptrend to be sustainable, healthy corrections are necessary. At present, BTC is moving through a corrective phase, identified as wave 4 in the Elliott Wave structure.
To gauge how far this correction may extend before wave 5 begins, we can apply Fibonacci Retracement. Two key levels stand out: 0.618 and 0.5.
At 0.618, we see a strong support zone, but it may not yet be the decisive level for confirming the wave count. If BTC reacts positively here and rallies into wave 5, the Elliott structure remains clean and valid.
At 0.5, the level aligns with an ideal Fibonacci retracement ratio and also shows up as an important structural support on the chart. A break below this could trigger deeper downside, as highlighted by the ascending trendline.
Long-Term Trading Plan
Entry 1: Around Fibonacci 0.618 at 105k
Entry 2: Around Fibonacci 0.5 at 99k
This outlook fits a medium-term plan, but if the second zone (99k) provides a strong reaction, it could also become the base for a longer-term bullish structure.
Stay disciplined, monitor these levels closely, and trade with proper risk management.
What’s your view on BTC’s long-term structure? Share your thoughts in the comments.
Hello traders,
Let’s take a medium- to long-term look at BTC. The broader trend is clearly bullish, but for any uptrend to be sustainable, healthy corrections are necessary. At present, BTC is moving through a corrective phase, identified as wave 4 in the Elliott Wave structure.
To gauge how far this correction may extend before wave 5 begins, we can apply Fibonacci Retracement. Two key levels stand out: 0.618 and 0.5.
At 0.618, we see a strong support zone, but it may not yet be the decisive level for confirming the wave count. If BTC reacts positively here and rallies into wave 5, the Elliott structure remains clean and valid.
At 0.5, the level aligns with an ideal Fibonacci retracement ratio and also shows up as an important structural support on the chart. A break below this could trigger deeper downside, as highlighted by the ascending trendline.
Long-Term Trading Plan
Entry 1: Around Fibonacci 0.618 at 105k
Entry 2: Around Fibonacci 0.5 at 99k
This outlook fits a medium-term plan, but if the second zone (99k) provides a strong reaction, it could also become the base for a longer-term bullish structure.
Stay disciplined, monitor these levels closely, and trade with proper risk management.
What’s your view on BTC’s long-term structure? Share your thoughts in the comments.
🔥 BrianLionCapital – Where Top Traders Unite
✅ Accurate signals & exclusive analysis: 10–15 signals daily with continuous market insights
⏳ Every minute you hesitate is a winning opportunity slipping away!
t.me/+-C-Pc_SOCPRjMmQ9
✅ Accurate signals & exclusive analysis: 10–15 signals daily with continuous market insights
⏳ Every minute you hesitate is a winning opportunity slipping away!
t.me/+-C-Pc_SOCPRjMmQ9
면책사항
해당 정보와 게시물은 금융, 투자, 트레이딩 또는 기타 유형의 조언이나 권장 사항으로 간주되지 않으며, 트레이딩뷰에서 제공하거나 보증하는 것이 아닙니다. 자세한 내용은 이용 약관을 참조하세요.