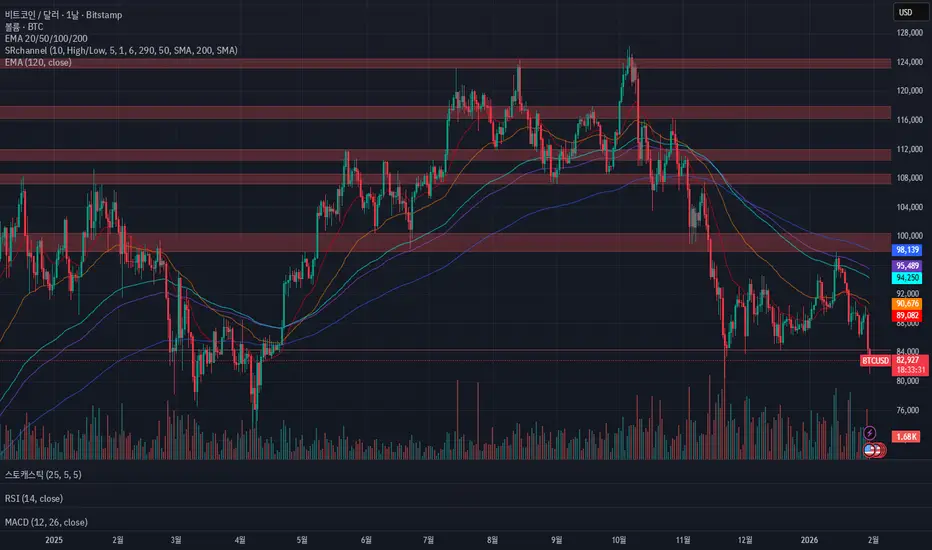
This chart shows Bitcoin’s current market structure across multiple timeframes, including key support and resistance levels, trend direction, and momentum indicators.
It is designed for monitoring price action and identifying potential trading opportunities based on trend continuation or reversal signals.
This setup is used as part of a personal trading dashboard for tracking Bitcoin in real time.
It is designed for monitoring price action and identifying potential trading opportunities based on trend continuation or reversal signals.
This setup is used as part of a personal trading dashboard for tracking Bitcoin in real time.
면책사항
해당 정보와 게시물은 금융, 투자, 트레이딩 또는 기타 유형의 조언이나 권장 사항으로 간주되지 않으며, 트레이딩뷰에서 제공하거나 보증하는 것이 아닙니다. 자세한 내용은 이용 약관을 참조하세요.
면책사항
해당 정보와 게시물은 금융, 투자, 트레이딩 또는 기타 유형의 조언이나 권장 사항으로 간주되지 않으며, 트레이딩뷰에서 제공하거나 보증하는 것이 아닙니다. 자세한 내용은 이용 약관을 참조하세요.