A few reasons for this bearish outlook. Mostly comparing 2017 to the present day together with study on multiple time frames.
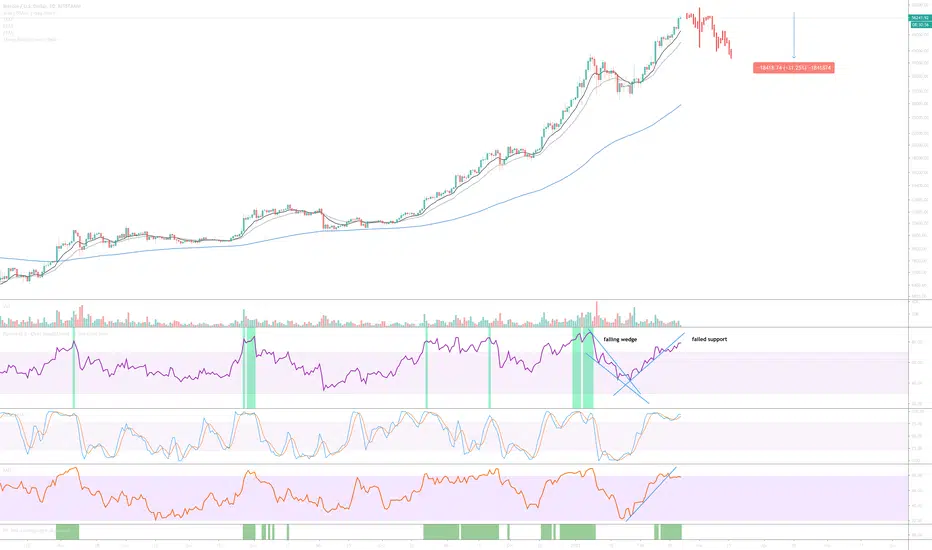
The blue line on the above 1-day chart is our bull market support 21-week moving average. Fear will likely be high around the time price action approaches it. This will be an excellent moment to pick up some discounted Bitcoin.
The blue line on the above 1-day chart is our bull market support 21-week moving average. Fear will likely be high around the time price action approaches it. This will be an excellent moment to pick up some discounted Bitcoin.
액티브 트레이드
노트
Noticed a lot of 'buy the dip' behaviour.Circled in orange below is the Stochastic RSI. If you're wondering what dip to buy, wait until the Stochastic RSI is rotating and crossing up 20. Right now it is facing downward, you're only burning cash at this moment.
노트
PS: I know I said 'mid-March' above but at the rate we're going we might get there by mid-week! Which is fine, just wait for the rotation in Stochastic RSI.액티브 트레이드
Breakdown from rising wedge. Price action might rise to test resistance. Notwithstanding a retest the daily chart is exceptionally bearish. Look at the Stochastic RSI crossing down under 20.매매 수동청산
Mid-March has come and gone, the conditions of the original idea are now void.Got to $43k in early March.
노트
Although closed were this idea still opened the target would now be ~$48k거래청산: 타겟 닿음
면책사항
해당 정보와 게시물은 금융, 투자, 트레이딩 또는 기타 유형의 조언이나 권장 사항으로 간주되지 않으며, 트레이딩뷰에서 제공하거나 보증하는 것이 아닙니다. 자세한 내용은 이용 약관을 참조하세요.
면책사항
해당 정보와 게시물은 금융, 투자, 트레이딩 또는 기타 유형의 조언이나 권장 사항으로 간주되지 않으며, 트레이딩뷰에서 제공하거나 보증하는 것이 아닙니다. 자세한 내용은 이용 약관을 참조하세요.