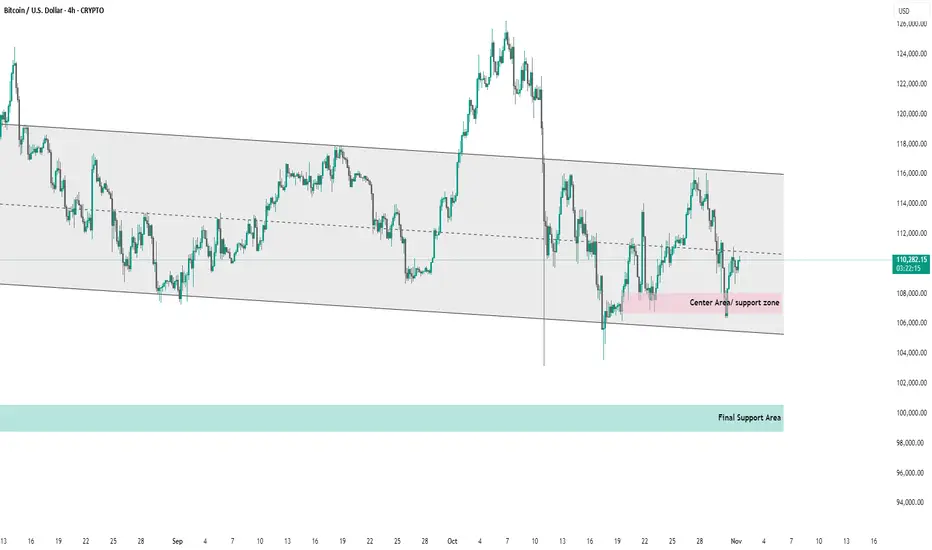
chart shows Bitcoin (BTC/USD) on the 4-hour timeframe within a descending channel pattern.
Key observations:
Channel Trend: BTC is trading inside a downward-sloping channel, indicating a medium-term bearish structure.
Current Price: Around $110,292.
Center Area / Support Zone: Highlighted in pink (~$107,000–$109,000) — acting as a short-term support or potential bounce region.
Final Support Area: Marked in green (~$98,000–$100,000) — a critical demand zone where strong buying interest may appear if price breaks below the current support.
Summary:
Bitcoin remains in a downward channel, consolidating near mid-support. A rebound from the pink zone could target the channel’s midline or upper boundary, while a break below $107,000 might lead to a test of the final support area near $100,000.
관련 발행물
면책사항
해당 정보와 게시물은 금융, 투자, 트레이딩 또는 기타 유형의 조언이나 권장 사항으로 간주되지 않으며, 트레이딩뷰에서 제공하거나 보증하는 것이 아닙니다. 자세한 내용은 이용 약관을 참조하세요.
면책사항
해당 정보와 게시물은 금융, 투자, 트레이딩 또는 기타 유형의 조언이나 권장 사항으로 간주되지 않으며, 트레이딩뷰에서 제공하거나 보증하는 것이 아닙니다. 자세한 내용은 이용 약관을 참조하세요.