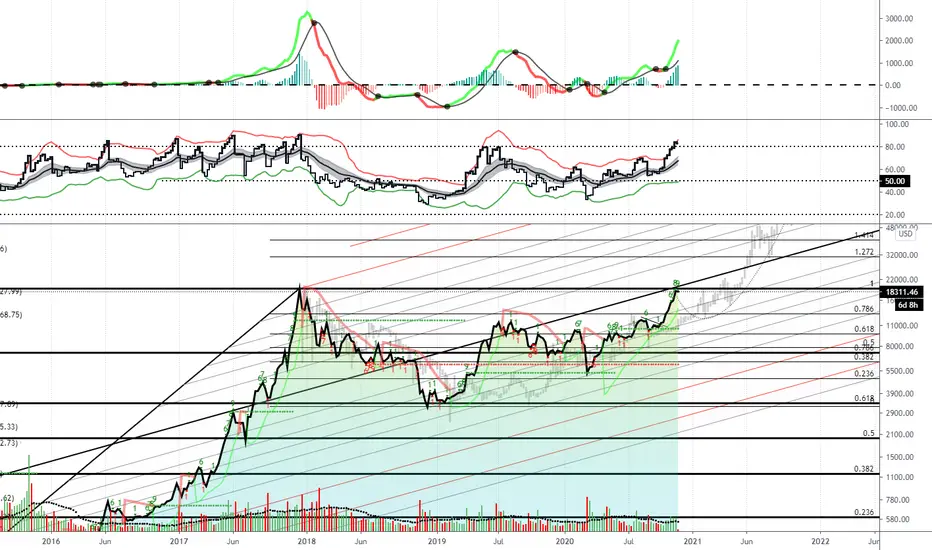
As BTC tests 20K levels, we are looking for this previous ath to come in as hard resistance initially. The TD indicator flashing a green 9 on the weekly time frame, suggesting the end of the bullish weekly count. RSI is over 80% buyers, stretching out the 2 st. deviations on this indicator - suggesting overbought. Ghost bars from 2015-2017 market cycle layered on top of this chart (grey bars) shows the last battle BTC saw as it approached the ath. Looking for this to repeat. I hope you are ready to buy this dip!
관련 발행물
면책사항
해당 정보와 게시물은 금융, 투자, 트레이딩 또는 기타 유형의 조언이나 권장 사항으로 간주되지 않으며, 트레이딩뷰에서 제공하거나 보증하는 것이 아닙니다. 자세한 내용은 이용 약관을 참조하세요.
면책사항
해당 정보와 게시물은 금융, 투자, 트레이딩 또는 기타 유형의 조언이나 권장 사항으로 간주되지 않으며, 트레이딩뷰에서 제공하거나 보증하는 것이 아닙니다. 자세한 내용은 이용 약관을 참조하세요.