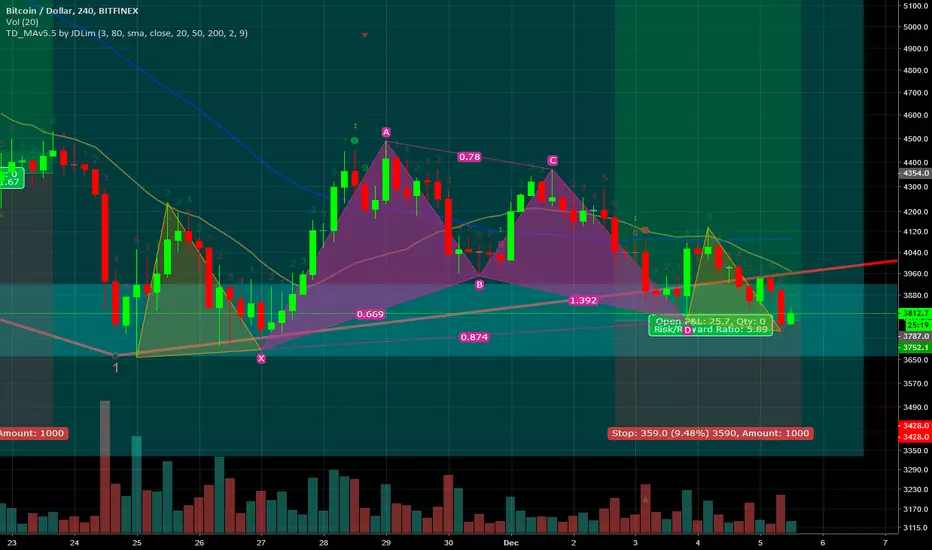
The 4 hour chart shows a symmetrical pattern of triangles which usually means the congestion pattern is nearing the end of its life and a breakout is coming soon.
It could go either way, I am hoping it's up but if it turns out to be down I am going to be looking get out of my long and start looking at shorts.
The 4 hour TD sequential count is almost to 9 and is on a red count which means it could definitely break upward very strongly from here.
It could go either way, I am hoping it's up but if it turns out to be down I am going to be looking get out of my long and start looking at shorts.
The 4 hour TD sequential count is almost to 9 and is on a red count which means it could definitely break upward very strongly from here.
관련 발행물
면책사항
이 정보와 게시물은 TradingView에서 제공하거나 보증하는 금융, 투자, 거래 또는 기타 유형의 조언이나 권고 사항을 의미하거나 구성하지 않습니다. 자세한 내용은 이용 약관을 참고하세요.
면책사항
이 정보와 게시물은 TradingView에서 제공하거나 보증하는 금융, 투자, 거래 또는 기타 유형의 조언이나 권고 사항을 의미하거나 구성하지 않습니다. 자세한 내용은 이용 약관을 참고하세요.