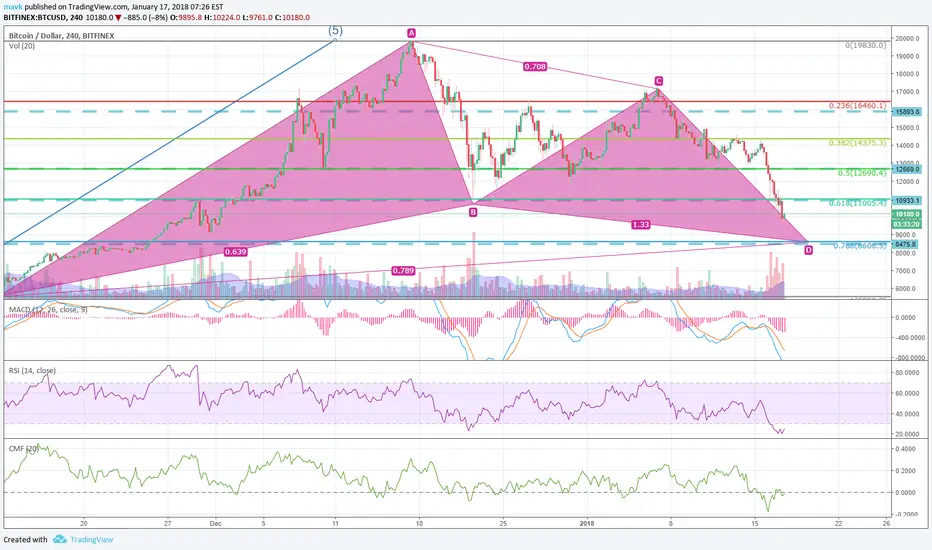
GARTLEY PATTERN coming to and and.
This here is a almost perfect example of Gartley's pattern, numbers which are specified for this pattern are almost 100% correct here!
Buy between 8600-11000..
Ps. RSI is extremely oversold on this 4h chart.
This here is a almost perfect example of Gartley's pattern, numbers which are specified for this pattern are almost 100% correct here!
Buy between 8600-11000..
Ps. RSI is extremely oversold on this 4h chart.
노트
MACD and RSI started showing divergence on 1hour candlesticks. Good sign as we are getting closer to the bottom support 8600. Dip is going to be over soon.노트
Quasimodo showing in 15min candles. Possible long entry!면책사항
이 정보와 게시물은 TradingView에서 제공하거나 보증하는 금융, 투자, 거래 또는 기타 유형의 조언이나 권고 사항을 의미하거나 구성하지 않습니다. 자세한 내용은 이용 약관을 참고하세요.
면책사항
이 정보와 게시물은 TradingView에서 제공하거나 보증하는 금융, 투자, 거래 또는 기타 유형의 조언이나 권고 사항을 의미하거나 구성하지 않습니다. 자세한 내용은 이용 약관을 참고하세요.