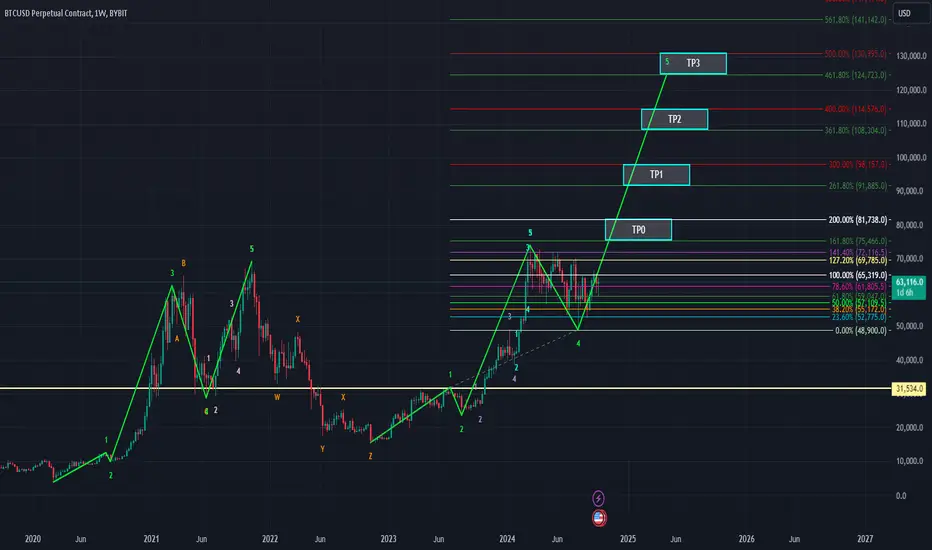
In this chart, we observe a clear Elliott Wave structure with five impulsive waves, indicating a potential bullish continuation. The Fibonacci extensions are plotted, highlighting possible Take Profit (TP) levels based on the wave projections.
Wave 1 to 5 completed, with Wave 5 potentially leading to significant price growth.
The Fibonacci retracement levels show key support areas, while the Fibonacci extensions suggest potential upside targets.
Key Targets:
TP0: MAX 81,738.0 (168% - 200% Fibonacci)
TP1: MAX 98,157.0 (261% - 300% Fibonacci)
TP2: MAX 114,576.0 (361% - 400% Fibonacci)
TP3: MAX 130,995.0 (461% - 500% Fibonacci)
The current price action is in consolidation, suggesting a breakout may occur soon. A strong move past TP0 could accelerate the upward momentum towards the higher TP levels.
Keep an eye on support levels around 63,068.0 and potential correction zones before a breakout occurs.
Disclaimer: This is just my personal view based on technical analysis, and it is not financial advice. Please conduct your own research and trade responsibly!
면책사항
해당 정보와 게시물은 금융, 투자, 트레이딩 또는 기타 유형의 조언이나 권장 사항으로 간주되지 않으며, 트레이딩뷰에서 제공하거나 보증하는 것이 아닙니다. 자세한 내용은 이용 약관을 참조하세요.
면책사항
해당 정보와 게시물은 금융, 투자, 트레이딩 또는 기타 유형의 조언이나 권장 사항으로 간주되지 않으며, 트레이딩뷰에서 제공하거나 보증하는 것이 아닙니다. 자세한 내용은 이용 약관을 참조하세요.