Hello
It's a Bitcoin Guide.
If you "follow"
You can receive real-time movement paths and comment notifications on major sections.
If my analysis was helpful,
Please click the booster button at the bottom.

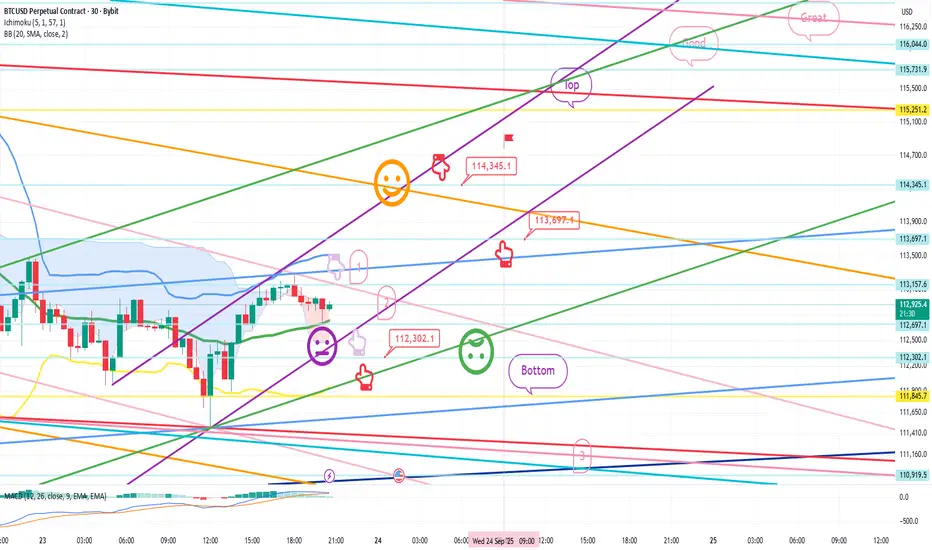
This is Bitcoin's 30-minute chart.
There's an indicator release near 11:00 AM on the Nasdaq,
and I expected a small fluctuation.
I proceeded as safely as possible, considering the current situation.
*When the red finger moves,
One-way long position strategy:
1. Long position entry point at $112,302.1 / Stop loss price if the green support line is broken.
2. Long position initial target at $114,345.1 -> Target prices in order of Top, Good, Great.
After reaching the target price of $114.3K,
you can re-enter the long position at the indicated price of $113.6K.
In the case of 1->2 above,
there's a strong possibility of an upward movement along the purple parallel line. (The 5+15 pattern is still in place.)
The current rebound has already formed a double bottom,
so a drop below the bottom
is not a good move for long positions.
In case of a delay, I've indicated up to section 3 at the bottom.
Thanks to the recent interest from newcomers,
I've made this post publicly available for the first time in a while.
Please use my analysis for reference only.
I hope you operate safely, with a focus on principled trading and stop-loss orders.
Thank you.
It's a Bitcoin Guide.
If you "follow"
You can receive real-time movement paths and comment notifications on major sections.
If my analysis was helpful,
Please click the booster button at the bottom.
This is Bitcoin's 30-minute chart.
There's an indicator release near 11:00 AM on the Nasdaq,
and I expected a small fluctuation.
I proceeded as safely as possible, considering the current situation.
*When the red finger moves,
One-way long position strategy:
1. Long position entry point at $112,302.1 / Stop loss price if the green support line is broken.
2. Long position initial target at $114,345.1 -> Target prices in order of Top, Good, Great.
After reaching the target price of $114.3K,
you can re-enter the long position at the indicated price of $113.6K.
In the case of 1->2 above,
there's a strong possibility of an upward movement along the purple parallel line. (The 5+15 pattern is still in place.)
The current rebound has already formed a double bottom,
so a drop below the bottom
is not a good move for long positions.
In case of a delay, I've indicated up to section 3 at the bottom.
Thanks to the recent interest from newcomers,
I've made this post publicly available for the first time in a while.
Please use my analysis for reference only.
I hope you operate safely, with a focus on principled trading and stop-loss orders.
Thank you.
거래청산: 스탑 닿음
Hello,It's a Bitcoin Guide.
I'll check the movement since the analysis was written on September 23rd.
This is a 30-minute chart for the Nasdaq.
I've marked the key areas with black fingers.
In the red finger long position strategy,
if it fails to touch the purple 1 area at the top,
it continues to fall.
If it falls directly to the bottom,
it breaks out of the long position in area 2,
and falls sharply to area 3.
After breaking the true blue support line, a rebound is in progress.
I'll check the overall movement.
This is a 30-minute chart for Bitcoin.
I've marked the key areas with black fingers.
In the red finger long position strategy,
after entering a long position at $112,302.1, the green support line was broken.
The strategy was cut.
Similar to the Nasdaq, the decline continued,
falling near the bottom -> 3rd zone,
then rebounding without breaking the light blue support line.
The bottom 3rd zone was barely touched.
Yesterday, it would have normally rebounded immediately,
but it ended up playing a trick on the Nasdaq as it coupled with it.
The low was broken,
and a double bottom has occurred three times.
In any case, if it holds without falling to the mid-term pattern recovery level at the bottom,
it's a good long position.
Coupling occurred during a major Nasdaq decline,
and while this is a difficult area,
it's a shame,
but ultimately, operating with a principled trading strategy will yield profits.
Stop-loss prices must be maintained under all circumstances.
Analysis without a stop-loss price is not helpful in actual trading.
Thank you.
노트
Hello,It's a Bitcoin Guide.
I'll check the movement since writing the analysis on September 24th.
This is a 30-minute chart of the Nasdaq.
I've marked the major sections with black fingers.
The light blue fingers indicate a short->long switching strategy.
The short entry point at the top, 24,684.1,
has not been touched, resulting in a vertical decline.
The decline continued from the bottom, marked below, to section 1, to 24,439.4, and after an additional daily candle was created today,
further declines are ongoing.
Yesterday, the 12-hour MACD dead cross pressure developed,
and the price is falling strongly. The medium-term pattern has been broken,
and a MACD dead cross is in progress on the daily chart.
Yesterday, even a sideways move seemed likely to succeed, but as expected, the Nasdaq is the problem again.
This is a 30-minute Bitcoin chart.
I've marked key areas with black fingers.
Similar to the Nasdaq,
the light blue fingers indicate a short-to-long switching strategy.
After entering a short position at $113,597.1 at the top,
the price closed sideways without breaking through the pink resistance line.
After an additional daily candle was created today,
yesterday's long switching point at $112,587.8 -> After touching the first area,
it is moving sideways just before touching the bottom.
Since yesterday's strategy significantly detoured, opening a support line and then declining,
the strategy was manually liquidated.
If the Nasdaq had held on a bit yesterday,
it would have been perfect, but unfortunately, it coupled and fell into the danger zone.
Ultimately, the $113,697.1 level became the best short entry point,
and further declines from the current level are not good for Bitcoin.
Perhaps because the market is difficult, participation continues to decline.
I'm no longer motivated.
I hope everyone operates safely with disciplined trading in this difficult market.
Thank you.
노트
Hello,It's a Bitcoin Guide.
I'll check the movement since the analysis was written on September 25th.
This is a 30-minute chart of the Nasdaq.
I've marked key areas with black fingers.
In the short->long switching strategy with the light blue finger,
1. After initially entering a long position at the purple finger (24,316.5 points),
it fell to the second area, but successfully rebounded without breaking the green support line.
2. After entering a short position at the light blue finger (24,449.8 points) at the top,
it failed to break the pink resistance line.
3. At the bottom, it switched to a long position at the light blue finger (24,282.4 points).
The green support line was partially damaged,
but it held well, ending in a downward sideways trend.
As the long position re-entry zone from the final 1st zone is completed,
Friday -> Monday, the target price is at the top.
With the price breaking through the Top, Good, and 3 zones,
the Nasdaq is maintaining its upward trend without any significant issues.
This is a 30-minute Bitcoin chart.
The key zones are marked with black fingers.
In the upper left corner, the purple finger is
using the strategy of maintaining the short position at $113,697.1 entered on the 24th.
*After the purple finger touches zone 1 at the bottom -> the light blue finger switches to the long position.
Or, if the price immediately falls, the strategy is to wait for a long position at the bottom.
As you can see, after maintaining a short position at 113.6K,
the price continued to decline vertically without touching the first section at the top.
The long position waiting area bottomed out, and finally touched the third section.
Due to the weekend's movement, a new Gap8 section was created at the bottom.
The reason for the decline without a wave in the middle is that it held steady,
and then coupled with the Nasdaq, and a similar decline occurred at 1:00 AM.
After moving sideways over the weekend, it touched the first short position entry area last week,
and is now rebounding near the first target price of $112,535.1, the light blue finger in the upper right corner.
After the third long entry, the price successfully rebounded, maintaining the light blue support line without breaking away. Therefore, the strategy is considered active.
As I explained in last week's video,
the daily support + weekly centerline retouch
is a retouch zone in a long-term pattern.
While the Nasdaq's movements will likely diverge,
it's a risky zone, so I hoped it wouldn't touch it.
However, it has accurately touched the third zone and is rebounding.
I'm maintaining my perspective without changing it.
The long position entry point was pushed back to the third zone I indicated,
but it has successfully rebounded.
I'll elaborate on the details in the analysis article.
Thank you.
*비트코인가이드 공식텔레그램 Telegram
t.me/BTG_Group
*빙엑스 BingX 50%DC+$5,000 (총1회수수료)
bingx.com/invite/YBM3A4
*바이비트 Bybit 20%DC+$5,020
partner.bybit.com/b/Bitcoin_Guide
*앞으로는 하단의 네이버카페에서만 활동합니다.
cafe.naver.com/loanlife82
t.me/BTG_Group
*빙엑스 BingX 50%DC+$5,000 (총1회수수료)
bingx.com/invite/YBM3A4
*바이비트 Bybit 20%DC+$5,020
partner.bybit.com/b/Bitcoin_Guide
*앞으로는 하단의 네이버카페에서만 활동합니다.
cafe.naver.com/loanlife82
관련 발행물
면책사항
해당 정보와 게시물은 금융, 투자, 트레이딩 또는 기타 유형의 조언이나 권장 사항으로 간주되지 않으며, 트레이딩뷰에서 제공하거나 보증하는 것이 아닙니다. 자세한 내용은 이용 약관을 참조하세요.