Hello
It's a Bitcoin Guide.
If you "follow"
You can receive real-time movement paths and comment notifications on major sections.
If my analysis was helpful,
Please click the booster button at the bottom.

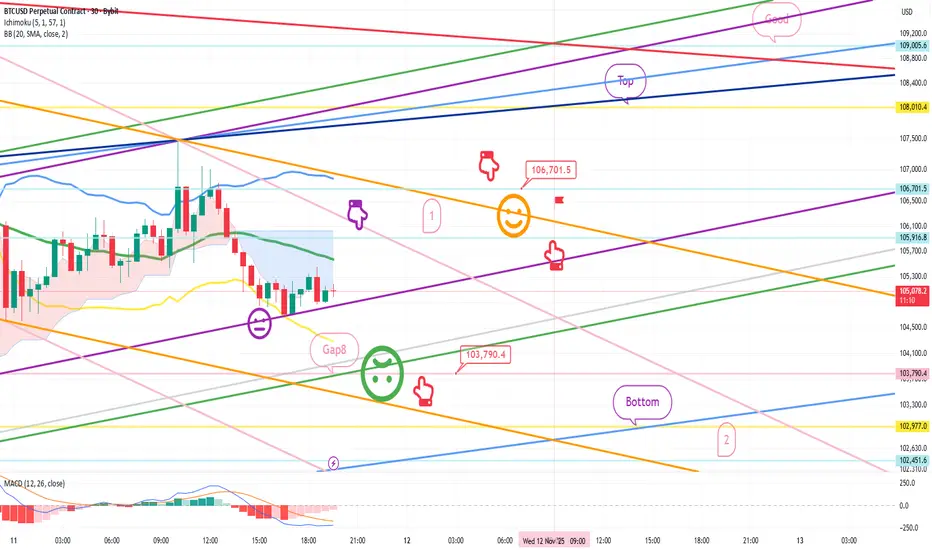
This is a Bitcoin 30-minute chart.
There are no separate Nasdaq indicators.
I developed a strategy based on the lower gap retracement of both Bitcoin and Nasdaq.
*Conditional long position strategy when the red finger moves
1. Confirm the first touch of the purple finger at the top (autonomous short)
Switch to a long position at the bottom at $103,790.4 /
Stop-loss price if the green support line is completely broken or the bottom is touched
2. First target for a long position at $106,701.5 / Target prices are Top and Good in that order.
If the strategy is successful, the first section is used to re-enter the long position.
If a correction occurs immediately without touching the first section at the top,
I'll wait for a long position at the bottom. Looking at the overall picture today, if the price drops to the bottom,
the medium-term pattern will be broken.
The purple support line must be maintained or the upper limit must be reached at 106.7K.
A rebound in the 1+4 range is required without breaking the green support line.
The Nasdaq variable is important, so please keep a close eye on the movement.
I hope you operate safely, with principled trading and stop-loss orders essential.
Thank you.
It's a Bitcoin Guide.
If you "follow"
You can receive real-time movement paths and comment notifications on major sections.
If my analysis was helpful,
Please click the booster button at the bottom.
This is a Bitcoin 30-minute chart.
There are no separate Nasdaq indicators.
I developed a strategy based on the lower gap retracement of both Bitcoin and Nasdaq.
*Conditional long position strategy when the red finger moves
1. Confirm the first touch of the purple finger at the top (autonomous short)
Switch to a long position at the bottom at $103,790.4 /
Stop-loss price if the green support line is completely broken or the bottom is touched
2. First target for a long position at $106,701.5 / Target prices are Top and Good in that order.
If the strategy is successful, the first section is used to re-enter the long position.
If a correction occurs immediately without touching the first section at the top,
I'll wait for a long position at the bottom. Looking at the overall picture today, if the price drops to the bottom,
the medium-term pattern will be broken.
The purple support line must be maintained or the upper limit must be reached at 106.7K.
A rebound in the 1+4 range is required without breaking the green support line.
The Nasdaq variable is important, so please keep a close eye on the movement.
I hope you operate safely, with principled trading and stop-loss orders essential.
Thank you.
액티브 트레이드
Hello,It's a Bitcoin Guide.
I'll check the movement since writing the analysis on November 11th.
This is a 30-minute chart of the Nasdaq.
I've marked the major sections with black fingers.
In the red finger long position strategy,
without touching the purple section 1 at the top,
with the red finger at the bottom, after entering a long position at 25,419.1 points,
without breaking the purple support line,
it closed after a slight rebound.
A new daily candlestick was created today,
and the rebound continues from section 1 to near the top section.
The Nasdaq appears to be ignoring the gap section and
rebounding.
This is our 30-minute chart of our beloved Bitcoin. I've marked the key areas with black fingers.
In the red finger long position strategy,
since there was no touch at the top of the first area,
we're waiting for the final long position at the bottom area.
The second area, marked at $102,451.6,
slightly pushed back after touching the lower tail,
and successfully rebounded without breaking the light blue support line.
It's currently rebounding to around $2,600.
The strategy is active.
The MACD dead cross on the monthly chart is in progress,
and it needs to be coupled with the Nasdaq rebound.
Bitcoin is in a state of flux.
For those holding long positions, don't forget to adjust your stop-loss.
I hope you'll continue to operate well today, with a strict stop-loss strategy and a strict stop-loss.
Thank you.
거래청산: 스탑 닿음
Hello,It's a Bitcoin Guide.
I took a break last week due to various fatigue factors.
I'll check the movement since my last analysis on November 12th.
This is a 30-minute chart for the Nasdaq.
Key areas are marked with black fingers.
After touch 1 -> Red finger: Long position strategy
The price failed to touch the 1st area of the purple finger marked above,
and fell to the 2nd area before closing.
During Thursday, Friday, and the weekend, when I was away,
it fell sharply from the bottom to the gap to 24.5K,
and then rebounded slightly.
This is a 30-minute chart for Bitcoin.
Key areas are marked with black fingers.
I connected the strategy after entering a long position at $102,451.6 with the purple finger at the bottom left.
Similar to the Nasdaq, the conditional red finger long position strategy:
*Purple finger 1st section at the top,
after entering an autonomous short position at $105,262.9
Long position switching section at the bottom: 104.4K -> After touching section 2,
the purple support line was broken.
The bottom, indicated below, fell sharply to $101,051.3 and closed.
Since the purple support line was broken,
the strategy was to cut losses.
This is the Bitcoin 1-hour chart.
Summary of the movements over the weekend, when I was away:
1) After entering a long position at $102,451.6, the price rose by $2,900. 2) The purple finger 1st section at the top, $105,262.9, is the best short entry point.
It's falling just under $13,000 to $93,016.7, indicated at the bottom.
The 1st section has become the absolute best short entry point.
Even though I'm providing the same information,
some people may find it offensive, and my analysis may always be wrong.
But I hope you don't compare it to analyses that don't even offer entry points.
The reason I post analysis articles on the 30-minute chart every day is
to provide real-time help to those who are long, short, or have no position in this difficult market with significant fluctuations.
For various reasons,
I hope those who find my articles uncomfortable will not read them.
This move has imprinted a MACD death cross on the monthly chart, and the long-term pattern is moving sideways near a key area.
While this may vary depending on the situation, it has reached the final major support area, and as expected, it is being influenced more by the Nasdaq correction than by the movement of Bitcoin itself.
Please note that this month's movements may lead to a mid- to long-term decline.
Always remember to trade on principle and use stop-loss orders.
Thank you.
노트
**I've significantly improved the quality of today's review, so please read it carefully.Hello,
It's a Bitcoin Guide.
I'll check the movement since writing the analysis on November 17th.
This is a 30-minute chart of the Nasdaq.
The reason I didn't do a separate analysis yesterday is
because I skipped analysis on Thursday and Friday last week,
and when I skipped analysis, it takes much longer to draw the chart.
I've only included the main price ranges,
and I've marked the key areas with black fingers.
At 11:30 AM, when the market opened, it touched the first area,
and then closed with a downward correction.
Today, a new daily candlestick formed, touched the bottom,
and is moving sideways.
The Nasdaq is currently in a MACD dead cross on the weekly chart. As of this writing, the dead cross will continue to bear down until 6:30 AM on the 22nd of this week.
The 24,034.5 point level marked below is a major support line, which is a combination of the daily Bollinger Band support and the weekly center line.
As for the Nasdaq, I believe Trump is managing it well, in his own style.
Barring any variables like war, I expect the current volatility to persist, but eventually, it will trend upward.
Please check this week's key points.
This is a 30-minute Bitcoin chart.
Key points are marked with black fingers.
In the lower left corner, a purple finger indicates the final long position entry point at $93,016.7.
In the red finger conditional long position strategy,
because the purple finger's first section at the top didn't touch,
we placed a final long position at the second section at $94,159.9.
At 11:30 AM, the same time as the Nasdaq, the second section was touched,
rising by about $1,800 and then closing at 91.8K, indicated below.
Since the long entry was followed by a strong rebound,
and real-time trading was possible,
unfortunately, the strategy was liquidated manually.
After a new daily candlestick was formed today,
the price corrected to the bright blue support line at the bottom, $89,597, and is now rebounding.
The key to yesterday's long strategy was
the first touch of the center line of the Bollinger Bands 4-hour chart.
Looking at it from the Tether Dominance perspective,
the 1+4 range is often used as a long position entry point.
But since it touched the center line of the 4-hour chart alone,
there's a high possibility of a false rebound followed by further corrections.
Conversely, I waited for a long position at the bottom of this range using a technical trading technique,
but it was ignored and coupled with the Nasdaq, leading to a simultaneous decline.
Because yesterday's low was broken again,
there's a high probability that it will reach a major support level this week.
Because Bitcoin is in the midst of a monthly MACD dead cross,
you should prepare yourself by 9:00 AM on December 1st.
(The Nasdaq is in the midst of a weekly MACD dead cross.)
This week and month's movements have been challenging for various reasons.
I believe many of you have experienced this in a market where some people lose money while others profit.
Hang in there, and I hope you'll smile brightly again in the distant future.
Weren't you with us when Bitcoin hit 2.5 million won?
In a world where resources are drying up and professional jobs are disappearing,
where else can you find such a strong support system?
You've probably made a lot.
Just let go of your greed and spend your life with Bitcoin, your good friend.
Don't take a short-term view,
but take a long-term view.
And, please operate safely, with principled trading and stop-loss orders as essential.
Thank you.
노트
Hello,It's a Bitcoin Guide.
I'll check the movement after writing the analysis on November 18th.
This is a 30-minute chart of the Nasdaq.
I've marked the major sections with black fingers.
Due to time constraints, I only calculated the Nasdaq wave patterns without drawing them.
Yesterday, in the conditional long position strategy,
there was no touch of the first section of the purple finger at the top,
so after entering the final long position at the bottom,
the price closed in a very sideways pattern.
After a new daily candlestick was formed today,
it first touched the lower Bollinger Band and is now rebounding.
I mentioned this week's importance,
but the overall direction will likely be determined by the release of the non-farm payrolls index tomorrow.
This is a 30-minute chart of Bitcoin. I've marked the key areas with black fingers.
Similar to the Nasdaq, in the conditional long position strategy,
*Purple finger at the top, section 1
After a short entry at $92,434.5, the extreme sideways movement ended.
After a new daily candlestick was created today,
the long position switching area shown by the red finger is a long entry at $90,000.8,
and is moving sideways.
There is a movement of approximately $4,500 above and below.
The strategy is active.
With a long position held at $90,000.8,
I'll connect today's strategy.
Thank you.
노트
Hello,It's a Bitcoin Guide.
I'll check the movement after writing the analysis on November 19th.
This is a 30-minute chart of the Nasdaq.
I've marked key areas with black fingers.
*In the red finger conditional long position strategy,
when the red finger touches point 1 -> switch to a long position at 24.5K.
If the red finger falls immediately without touching, the final long position is at point 2.
If the green support line is broken, the stop loss is set.
At the top, point 1 is not touched,
and at the bottom, the long position switching point touches $24,548.8,
and then the target price touches $24,840.1.
After a strong correction,
the long position is entered at point 2 at 24,433.8, and the V-shaped rebound concludes. The final target price has touched the top of the range and is moving sideways.
Yesterday's movement failed to touch the resistance line on the 4-hour Bollinger Band chart,
and it's in an ambiguous position, as it's said to be a true rebound.
There's an important indicator release scheduled for this week.
This is a 30-minute Bitcoin chart.
The key areas are marked with black fingers.
The purple finger in the lower left corner is the entry point for the 18-day long position.
I used the strategy at $90,000.8.
Similar to the Nasdaq, the conditional long position strategy
immediately touched the second area of the purple finger at the bottom,
without touching the first area.
The green support line was damaged,
but the price successfully rebounded, breaking through the pink resistance line.
After touching the first area at the top, it is now moving sideways.
The strategy is active.
A correction could have been connected from below the green support line to the final support line,
but a rebound is underway as it couples with the Nasdaq.
There's an important indicator release today this week.
For the Nasdaq, the weekly MACD is forming a dead cross,
and it would be good to keep an eye on whether a pullback to the key area below will occur.
For those who haven't seen the analysis,
I always make the review publicly available after each analysis,
so I think you know the direction.
I'll keep working hard today.
Thank you.
*비트코인가이드 공식텔레그램 Telegram
t.me/BTG_Group
*빙엑스 BingX 50%DC+$5,000 (총1회수수료)
bingx.com/invite/YBM3A4
*바이비트 Bybit 20%DC+$5,020
partner.bybit.com/b/Bitcoin_Guide
*앞으로는 하단의 네이버카페에서만 활동합니다.
cafe.naver.com/loanlife82
t.me/BTG_Group
*빙엑스 BingX 50%DC+$5,000 (총1회수수료)
bingx.com/invite/YBM3A4
*바이비트 Bybit 20%DC+$5,020
partner.bybit.com/b/Bitcoin_Guide
*앞으로는 하단의 네이버카페에서만 활동합니다.
cafe.naver.com/loanlife82
관련 발행물
면책사항
해당 정보와 게시물은 금융, 투자, 트레이딩 또는 기타 유형의 조언이나 권장 사항으로 간주되지 않으며, 트레이딩뷰에서 제공하거나 보증하는 것이 아닙니다. 자세한 내용은 이용 약관을 참조하세요.