Bitcoin line and time
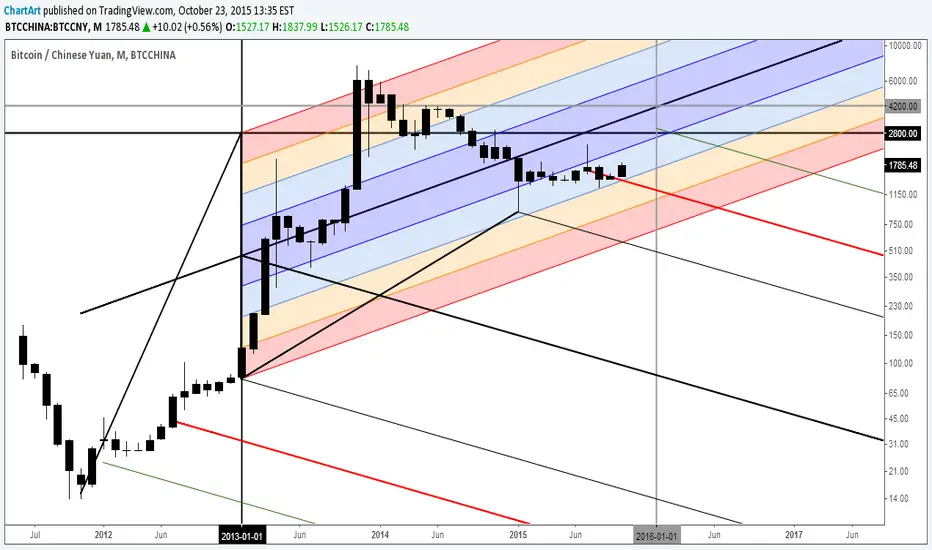
I discovered some interesting relationships that can be drawn as lines onto the Bitcoin monthly chart. It appears there is a older larger uptrend channel, in which the price is still in (blue channel).
Here is a zoomed-in screenshot of this chart:

P.S. An older bullish chart I made 3 months ago:

Here is a zoomed-in screenshot of this chart:
P.S. An older bullish chart I made 3 months ago:
면책사항
이 정보와 게시물은 TradingView에서 제공하거나 보증하는 금융, 투자, 거래 또는 기타 유형의 조언이나 권고 사항을 의미하거나 구성하지 않습니다. 자세한 내용은 이용 약관을 참고하세요.
면책사항
이 정보와 게시물은 TradingView에서 제공하거나 보증하는 금융, 투자, 거래 또는 기타 유형의 조언이나 권고 사항을 의미하거나 구성하지 않습니다. 자세한 내용은 이용 약관을 참고하세요.