Wave–particle duality is the concept in quantum mechanics that every particle or quantum entity may be described as either a particle or a wave.
Basically has 2 types of behavior.
Duality concept is present in Financial Markets
We have 2 directions of outcomes of the market activity.
UP and Down assumed as Bulls and Bears
Whatever we see on a chart is nothing but outcome of Interference of Bulls and Bears in a given TIME.
Indeed at given price we have certain confrontation of 2 forces. Like a spin of a particle, it has 2 CHARGES when MEASURED at given point of TIME: Positive and Negative.
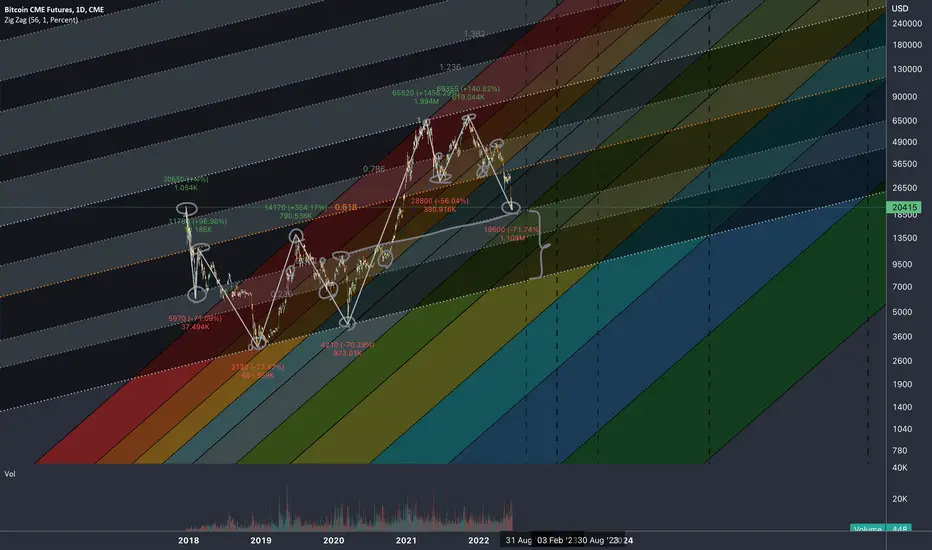
Wave dualism are applied to fractal with fibonacci ratios.
These ratios are used irregularly in my analyses not by a chance.
Just like the alternation of the dim and contrasting bright colors are used to simulate the Quantum Phenomena.
The steeper the angle of incline of fibonacci channels the more it is related to TIMING of the Fractal.
We witnessed in my number of ideas how Fibonacci ratios work well with reversals.
The direction of fib channels covers the MOMENTUM of the market representing the dualism of the market inside ratios.
Behavior of masses rhymes on lines of Fibonacci Channels which shows interconnectedness of critical points of the market activity.
Peaks and Bottoms must be indexed with fibonacci ratios and adjusted to golden ratio to make sense out of bits waves.
Crossing means a takeover of either of participants of the market activity.
Basically has 2 types of behavior.
Duality concept is present in Financial Markets
We have 2 directions of outcomes of the market activity.
UP and Down assumed as Bulls and Bears
Whatever we see on a chart is nothing but outcome of Interference of Bulls and Bears in a given TIME.
Indeed at given price we have certain confrontation of 2 forces. Like a spin of a particle, it has 2 CHARGES when MEASURED at given point of TIME: Positive and Negative.
Wave dualism are applied to fractal with fibonacci ratios.
These ratios are used irregularly in my analyses not by a chance.
Just like the alternation of the dim and contrasting bright colors are used to simulate the Quantum Phenomena.
The steeper the angle of incline of fibonacci channels the more it is related to TIMING of the Fractal.
We witnessed in my number of ideas how Fibonacci ratios work well with reversals.
The direction of fib channels covers the MOMENTUM of the market representing the dualism of the market inside ratios.
Behavior of masses rhymes on lines of Fibonacci Channels which shows interconnectedness of critical points of the market activity.
Peaks and Bottoms must be indexed with fibonacci ratios and adjusted to golden ratio to make sense out of bits waves.
Crossing means a takeover of either of participants of the market activity.
노트
The deeper it moves in either direction the more it increases the chances of opposite reaction. Depends on Rate of Change which is basically the angle of Fibonacci Channels.Unlock exclusive tools: fractlab.com
ᴀʟʟ ᴄᴏɴᴛᴇɴᴛ ᴘʀᴏᴠɪᴅᴇᴅ ʙʏ ꜰʀᴀᴄᴛʟᴀʙ ɪꜱ ɪɴᴛᴇɴᴅᴇᴅ ꜰᴏʀ ɪɴꜰᴏʀᴍᴀᴛɪᴏɴᴀʟ ᴀɴᴅ ᴇᴅᴜᴄᴀᴛɪᴏɴᴀʟ ᴘᴜʀᴘᴏꜱᴇꜱ ᴏɴʟʏ.
ᴘᴀꜱᴛ ᴘᴇʀꜰᴏʀᴍᴀɴᴄᴇ ɪꜱ ɴᴏᴛ ɪɴᴅɪᴄᴀᴛɪᴠᴇ ᴏꜰ ꜰᴜᴛᴜʀᴇ ʀᴇꜱᴜʟᴛꜱ.
ᴀʟʟ ᴄᴏɴᴛᴇɴᴛ ᴘʀᴏᴠɪᴅᴇᴅ ʙʏ ꜰʀᴀᴄᴛʟᴀʙ ɪꜱ ɪɴᴛᴇɴᴅᴇᴅ ꜰᴏʀ ɪɴꜰᴏʀᴍᴀᴛɪᴏɴᴀʟ ᴀɴᴅ ᴇᴅᴜᴄᴀᴛɪᴏɴᴀʟ ᴘᴜʀᴘᴏꜱᴇꜱ ᴏɴʟʏ.
ᴘᴀꜱᴛ ᴘᴇʀꜰᴏʀᴍᴀɴᴄᴇ ɪꜱ ɴᴏᴛ ɪɴᴅɪᴄᴀᴛɪᴠᴇ ᴏꜰ ꜰᴜᴛᴜʀᴇ ʀᴇꜱᴜʟᴛꜱ.
면책사항
이 정보와 게시물은 TradingView에서 제공하거나 보증하는 금융, 투자, 거래 또는 기타 유형의 조언이나 권고 사항을 의미하거나 구성하지 않습니다. 자세한 내용은 이용 약관을 참고하세요.
Unlock exclusive tools: fractlab.com
ᴀʟʟ ᴄᴏɴᴛᴇɴᴛ ᴘʀᴏᴠɪᴅᴇᴅ ʙʏ ꜰʀᴀᴄᴛʟᴀʙ ɪꜱ ɪɴᴛᴇɴᴅᴇᴅ ꜰᴏʀ ɪɴꜰᴏʀᴍᴀᴛɪᴏɴᴀʟ ᴀɴᴅ ᴇᴅᴜᴄᴀᴛɪᴏɴᴀʟ ᴘᴜʀᴘᴏꜱᴇꜱ ᴏɴʟʏ.
ᴘᴀꜱᴛ ᴘᴇʀꜰᴏʀᴍᴀɴᴄᴇ ɪꜱ ɴᴏᴛ ɪɴᴅɪᴄᴀᴛɪᴠᴇ ᴏꜰ ꜰᴜᴛᴜʀᴇ ʀᴇꜱᴜʟᴛꜱ.
ᴀʟʟ ᴄᴏɴᴛᴇɴᴛ ᴘʀᴏᴠɪᴅᴇᴅ ʙʏ ꜰʀᴀᴄᴛʟᴀʙ ɪꜱ ɪɴᴛᴇɴᴅᴇᴅ ꜰᴏʀ ɪɴꜰᴏʀᴍᴀᴛɪᴏɴᴀʟ ᴀɴᴅ ᴇᴅᴜᴄᴀᴛɪᴏɴᴀʟ ᴘᴜʀᴘᴏꜱᴇꜱ ᴏɴʟʏ.
ᴘᴀꜱᴛ ᴘᴇʀꜰᴏʀᴍᴀɴᴄᴇ ɪꜱ ɴᴏᴛ ɪɴᴅɪᴄᴀᴛɪᴠᴇ ᴏꜰ ꜰᴜᴛᴜʀᴇ ʀᴇꜱᴜʟᴛꜱ.
면책사항
이 정보와 게시물은 TradingView에서 제공하거나 보증하는 금융, 투자, 거래 또는 기타 유형의 조언이나 권고 사항을 의미하거나 구성하지 않습니다. 자세한 내용은 이용 약관을 참고하세요.