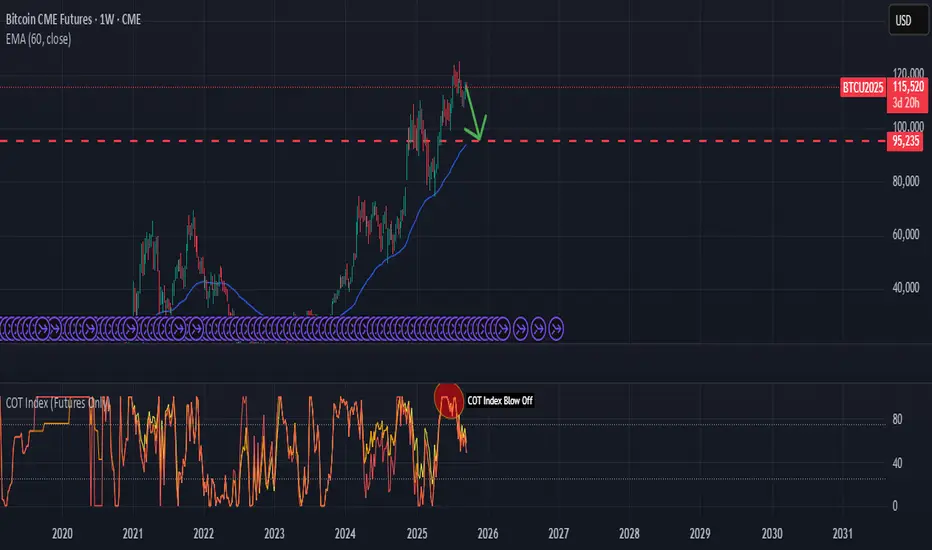
Bitcoin is showing signs of exhaustion after a strong rally into the $120k region. On the weekly timeframe, several signals point toward a potential corrective leg lower:
📊 Key Technicals
Major Supply Zone: $115k–$120k area has acted as resistance, with sellers defending this level.
Trend Structure: Price has broken momentum after the blow-off move and is now trading below recent highs.
EMA Support: Price is extended above the EMA 60 (94k), leaving room for mean reversion.
COT Data: Commercials are heavily net short with a COT Index blow-off signal, indicating distribution from strong hands to weak hands.
🎯 Trade Thesis
The risk-reward favors the short side from current levels.
Initial downside target sits at the $95k region (prior resistance turned support + EMA alignment).
A break of that level could open the door toward the $80k handle in the medium term.
📌 Plan
Entry: 114k–116k
Stop: Above 120k
Targets:
TP1: 95k
TP2: 80k
💡 This setup combines market structure, supply zone rejection, and institutional positioning via COT. The technical picture suggests Bitcoin is vulnerable to a deeper pullback before any further sustainable rally.
면책사항
이 정보와 게시물은 TradingView에서 제공하거나 보증하는 금융, 투자, 거래 또는 기타 유형의 조언이나 권고 사항을 의미하거나 구성하지 않습니다. 자세한 내용은 이용 약관을 참고하세요.
면책사항
이 정보와 게시물은 TradingView에서 제공하거나 보증하는 금융, 투자, 거래 또는 기타 유형의 조언이나 권고 사항을 의미하거나 구성하지 않습니다. 자세한 내용은 이용 약관을 참고하세요.