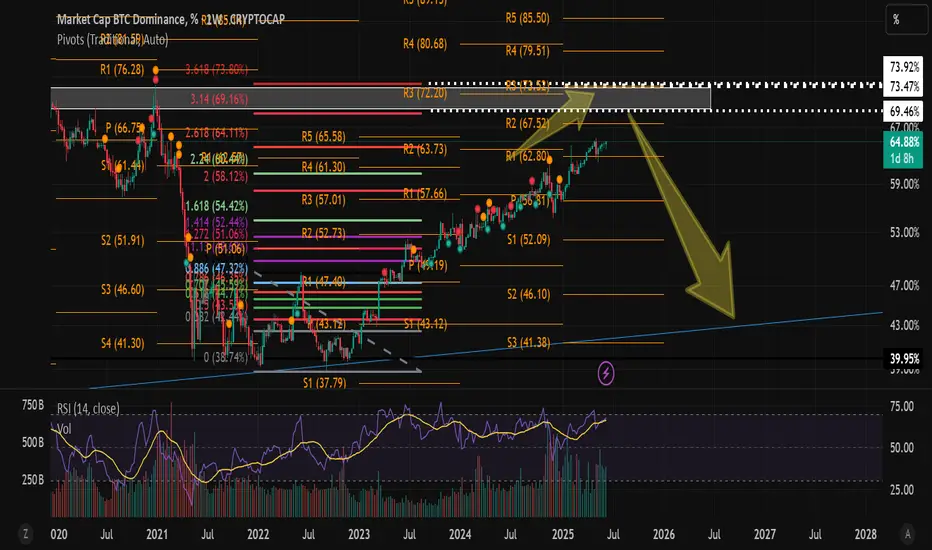
BTC Dominance is currently around 64.82%, sitting at a major multi-year resistance zone (64.5%–66.5%), with strong confluence from Fibonacci extensions, Pivot Points (R1 ~66.5%), and RSI (~67.24, near overbought).
This region has historically triggered reversals, and multiple indicators suggest exhaustion. The chart also projects a potential drop toward 52%, possibly 43–40%, aligning with key support levels and a long-term trendline.
Conclusion: BTC.D looks primed for a pullback, signaling the potential beginning of an altcoin rotation or altseason.
Disclaimer: This analysis is for educational purposes only and is purely speculative. It does not constitute financial advice. Always do your own research.
액티브 트레이드
This range appears to be marked at the top of the BTC.D chart with a white-dotted line and references the Fibonacci levels of 0.618 (69.46%) to 0.786 (73.92%), forming a major resistance zone.거래청산: 타겟 닿음
I am still believe bitcoin dominance could reach 70-72% range either it can give a spike towards that area so it's better to be a part of wait and watch situation because according to my analysis bitcoin can go even down futher towards 77k-74k levels before making peak towards 180k level.노트
There’s a strong possibility that Bitcoin may have formed a local top around October 6th. At the moment, liquidity appears to be drying up on the upside, while fresh liquidity is beginning to build around the 180K zone. However, before the market makes a move toward that level, there’s a higher probability that Bitcoin could correct down to the 70K–80K range.This potential retracement could serve as a healthy reset before the next major bull run begins. During this phase, we might also witness a true altseason, as many altcoins have recently shown deep wicks to the downside—indicating strong volatility and potential for recovery. It’s likely that the market could soon retrace to fill half or even the full size of those wicks in the coming days.
Overall, the market might remain in a corrective or consolidation phase for the next 2–3 months, or possibly longer, until sufficient liquidity accumulates around the 180K level. If that plays out, we could see one more strong leg to the upside in Q1 next year. For now, it’s best to stay patient and observe how the market reacts in the coming weeks.
노트
The market is currently showing renewed strength toward the 130K zone. This recent pullback appears to be a quick reset rather than a reversal. If the price manages to close above the 120K level, it would significantly increase the probability of a continuation rally, potentially leading to a new all-time high or an upward move toward the 130K area and beyond in the coming days.노트
The market is approaching a critical zone where it could soon confirm its next major move. If Bitcoin breaks and closes above the 120K level, it may trigger a continuation rally toward new all-time highs, potentially reaching the 130K+ zone.However, failure to sustain above 120K could lead to another downward leg, possibly revisiting the 80s–70s range before the next major uptrend.
노트
Recently, the market has experienced a strong pullback below the 100K mark. However, it’s now showing signs of recovery and reacting positively around this key level. If the market manages to sustain above 100K, we could witness the final leg of this bull run, potentially extending towards the 150K–160K range.On the other hand, if it fails to hold the 100K support, we may see a deeper correction towards 90K, or even 80K in a worst-case scenario. In that case, the next and possibly final bullish leg might unfold during Q1 2026, with the potential to push prices towards 180K or beyond.
면책사항
해당 정보와 게시물은 금융, 투자, 트레이딩 또는 기타 유형의 조언이나 권장 사항으로 간주되지 않으며, 트레이딩뷰에서 제공하거나 보증하는 것이 아닙니다. 자세한 내용은 이용 약관을 참조하세요.
면책사항
해당 정보와 게시물은 금융, 투자, 트레이딩 또는 기타 유형의 조언이나 권장 사항으로 간주되지 않으며, 트레이딩뷰에서 제공하거나 보증하는 것이 아닙니다. 자세한 내용은 이용 약관을 참조하세요.