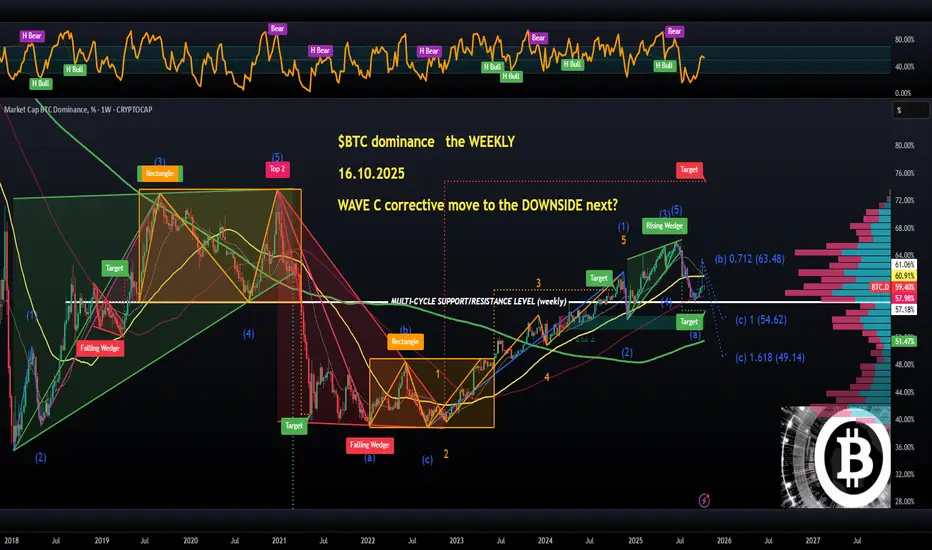
So the weekly chart is actually looking amazing for altcoins, we are most likely heading for a much deeper correction purely based on the technicals here, not speculation.
The most important level to watch is 57.2% as a multi-cycle SUPPORT/RESISTANCE level. Back in 2021, when that exact level broke down (orange RECTANCLE on the left side), it ended up crashing all the way down to 39%. That was a full-blown #Altseason which lasted for a few weeks.
Seasonality-wise, Q4 should be the best for crypto, so we would have a brilliant correlation if 57.2% becomes resistance again, so far, there was a bounce off it at the beginning of September, which triggered nothing but bleeding ever since.
So, this is a long-term view, if correct, then we should get a WAVE C correction to 54.6% or more optimistically, 49% or even below. I would bet on 49% personally, if I had to make a based guess.
👽💙
면책사항
해당 정보와 게시물은 금융, 투자, 트레이딩 또는 기타 유형의 조언이나 권장 사항으로 간주되지 않으며, 트레이딩뷰에서 제공하거나 보증하는 것이 아닙니다. 자세한 내용은 이용 약관을 참조하세요.
면책사항
해당 정보와 게시물은 금융, 투자, 트레이딩 또는 기타 유형의 조언이나 권장 사항으로 간주되지 않으며, 트레이딩뷰에서 제공하거나 보증하는 것이 아닙니다. 자세한 내용은 이용 약관을 참조하세요.