💀 Hey , how's it going ? Come over here — Satoshi got something for you !
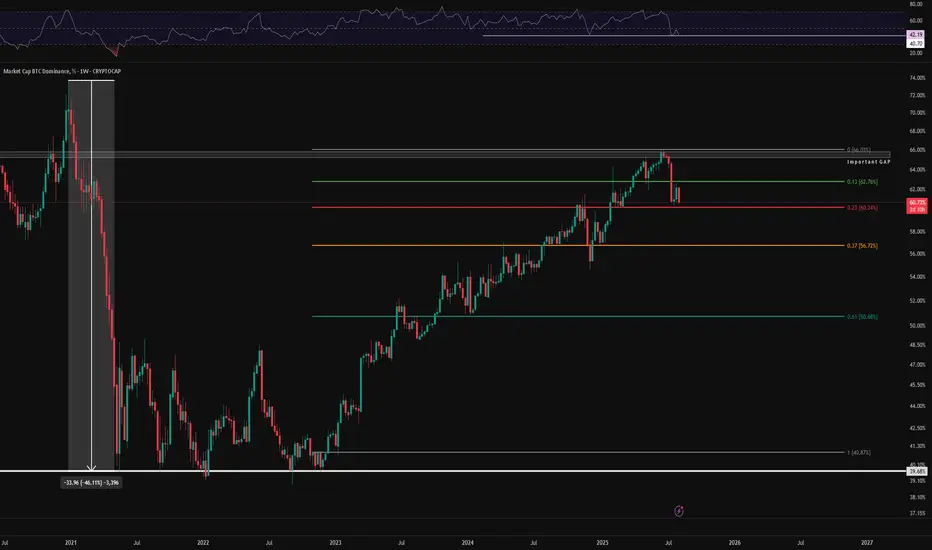
⏰ We’re analyzing BTC.D on the 1-Week timeframe .
🔜 On the weekly timeframe of Bitcoin dominance, here’s what we observe :
👀 In the weekly Bitcoin dominance chart , we had a sharp 46% drop after the Bitcoin halving in 2021, which led to the altcoin party .
🎮 Today, for the first time , its figures were adjusted and turned into a custom Fibonacci , drawn on the chart as follows :
Our starting point in the Fibonacci is at the beginning of 2023 , from the breakout above 40.87 to the peak at 66.03, which, in terms of timing, coincides with the Bitcoin halving .
A strong rejection from the 0 Fibonacci level caused a move towards the 0.13 level . A strong whale candle broke below this level , followed by a pullback to it, and then we moved towards the 0.23 level. With a break below the 0.23 level and losing that low , we can say that our bull run has started .

⚙️ Our key RSI zone is drawn at 41.49 . On the first touch of this area , we bounced and moved towards the 50 level , but were then rejected from 50 and moved towards the current low . Once this low is broken , we can say the altcoin party has begun .
❤️ Disclaimer : This analysis is purely based on my personal opinion and I only trade if the stated triggers are activated .
⏰ We’re analyzing BTC.D on the 1-Week timeframe .
🔜 On the weekly timeframe of Bitcoin dominance, here’s what we observe :
👀 In the weekly Bitcoin dominance chart , we had a sharp 46% drop after the Bitcoin halving in 2021, which led to the altcoin party .
🎮 Today, for the first time , its figures were adjusted and turned into a custom Fibonacci , drawn on the chart as follows :
Our starting point in the Fibonacci is at the beginning of 2023 , from the breakout above 40.87 to the peak at 66.03, which, in terms of timing, coincides with the Bitcoin halving .
A strong rejection from the 0 Fibonacci level caused a move towards the 0.13 level . A strong whale candle broke below this level , followed by a pullback to it, and then we moved towards the 0.23 level. With a break below the 0.23 level and losing that low , we can say that our bull run has started .
⚙️ Our key RSI zone is drawn at 41.49 . On the first touch of this area , we bounced and moved towards the 50 level , but were then rejected from 50 and moved towards the current low . Once this low is broken , we can say the altcoin party has begun .
❤️ Disclaimer : This analysis is purely based on my personal opinion and I only trade if the stated triggers are activated .
❄️ Join the Action Now ❄️
Telegram
t.me/CryptosWinter
Mexc
promote.mexc.com/r/HHAkF63P
Bitunix
bitunix.com/register?inviteCode=28r21f
Telegram
t.me/CryptosWinter
Mexc
promote.mexc.com/r/HHAkF63P
Bitunix
bitunix.com/register?inviteCode=28r21f
관련 발행물
면책사항
해당 정보와 게시물은 금융, 투자, 트레이딩 또는 기타 유형의 조언이나 권장 사항으로 간주되지 않으며, 트레이딩뷰에서 제공하거나 보증하는 것이 아닙니다. 자세한 내용은 이용 약관을 참조하세요.