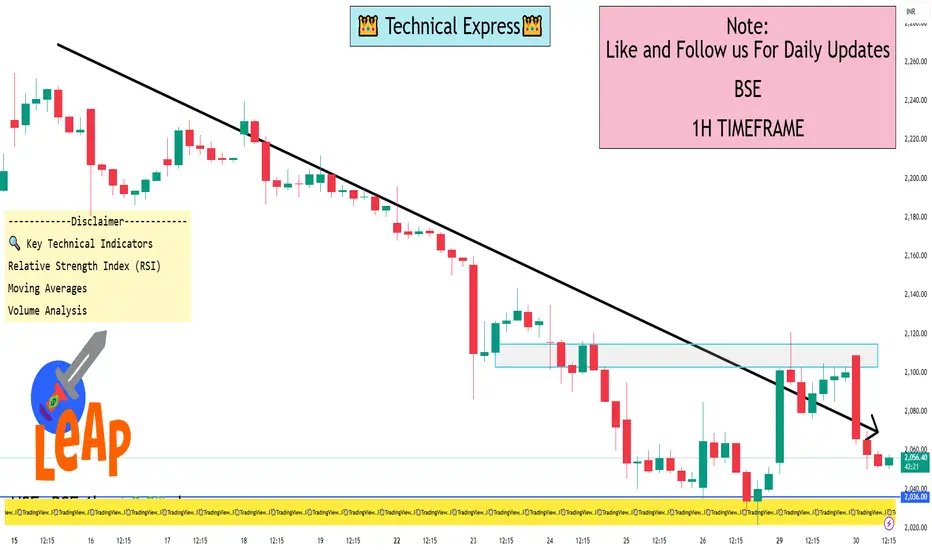
BSE is trading at ₹2,054.60, reflecting a 2.04% decline for the day.
📊 1-Hour Time Frame Technical Analysis
On the 1-hour chart, BSE Ltd. is exhibiting a "Strong Sell" signal across both technical indicators and moving averages. This suggests a prevailing short-term downtrend, with the stock trading below its key moving averages.
🔍 Key Technical Indicators
Relative Strength Index (RSI): Currently below 30, indicating the stock is in oversold territory and may be due for a short-term rebound.
Moving Averages: The stock is trading below its 5-day, 20-day, 50-day, 100-day, and 200-day moving averages, suggesting a bearish trend.
Volume Analysis: Recent trading volumes have been lower than average, indicating reduced investor participation.
📈 Support and Resistance Levels
Immediate Support: ₹2,000
Immediate Resistance: ₹2,100
A break below ₹2,000 could signal further downside, while a move above ₹2,100 may indicate a potential reversal.
⚠️ Considerations for Traders
Given the current "Strong Sell" signals, traders should exercise caution. It's advisable to wait for confirmation of a trend reversal before entering long positions. Utilizing a multi-timeframe analysis can provide a more comprehensive view of the stock's potential movements.
I built a Buy & Sell Signal Indicator with 85% accuracy.
📈 Get access via DM or
WhatsApp: wa.link/d997q0
Contact - +91 76782 40962
| Email: techncialexpress@gmail.com
| Script Coder | Trader | Investor | From India
📈 Get access via DM or
WhatsApp: wa.link/d997q0
Contact - +91 76782 40962
| Email: techncialexpress@gmail.com
| Script Coder | Trader | Investor | From India
관련 발행물
면책사항
해당 정보와 게시물은 금융, 투자, 트레이딩 또는 기타 유형의 조언이나 권장 사항으로 간주되지 않으며, 트레이딩뷰에서 제공하거나 보증하는 것이 아닙니다. 자세한 내용은 이용 약관을 참조하세요.