In trading, patterns on higher timeframes often carry deeper meaning.
What you’re seeing in this chart isn’t a forecast — it’s a learning opportunity.
Let’s break this down:
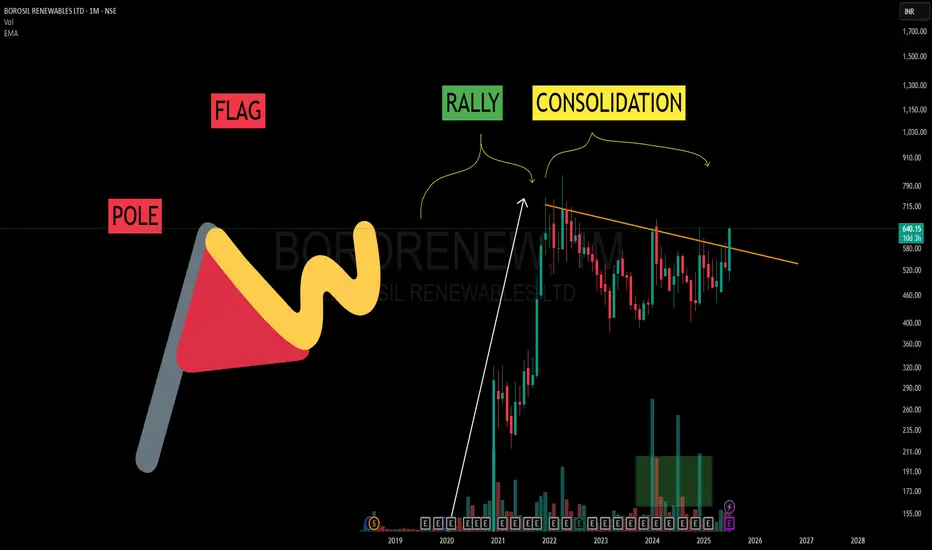
🔺 POLE:
This sharp rally from 2020–2022 represents a strong burst of momentum. That’s your Pole — it shows clean directional intent from market participants.
🏁 FLAG:
After the rally, price didn’t crash — it started consolidating. This sideways or slightly downward structure is known as the Flag.
It often appears as a phase of “cooling off” — traders taking profits, new buyers waiting.
📈 RALLY + CONSOLIDATION = Classic Flag & Pole
A rally followed by consolidation = textbook flag structure.
⏳ And here’s the takeaway:
When viewed on a Monthly (WTF - Way Too Far 😅) timeframe, these patterns take years to form. But that also means they carry weight.
No predictions here. Just learning.
Understanding market rhythm through structure > outcome can be your edge.
What you’re seeing in this chart isn’t a forecast — it’s a learning opportunity.
Let’s break this down:
🔺 POLE:
This sharp rally from 2020–2022 represents a strong burst of momentum. That’s your Pole — it shows clean directional intent from market participants.
🏁 FLAG:
After the rally, price didn’t crash — it started consolidating. This sideways or slightly downward structure is known as the Flag.
It often appears as a phase of “cooling off” — traders taking profits, new buyers waiting.
📈 RALLY + CONSOLIDATION = Classic Flag & Pole
A rally followed by consolidation = textbook flag structure.
⏳ And here’s the takeaway:
When viewed on a Monthly (WTF - Way Too Far 😅) timeframe, these patterns take years to form. But that also means they carry weight.
No predictions here. Just learning.
Understanding market rhythm through structure > outcome can be your edge.
🎯 Master My Self-Made Trading Strategy
📈 Telegram (Learn Today): t.me/hashtaghammer
✅ WhatsApp (Learn Today): wa.me/919455664601
📈 Telegram (Learn Today): t.me/hashtaghammer
✅ WhatsApp (Learn Today): wa.me/919455664601
관련 발행물
면책사항
해당 정보와 게시물은 금융, 투자, 트레이딩 또는 기타 유형의 조언이나 권장 사항으로 간주되지 않으며, 트레이딩뷰에서 제공하거나 보증하는 것이 아닙니다. 자세한 내용은 이용 약관을 참조하세요.