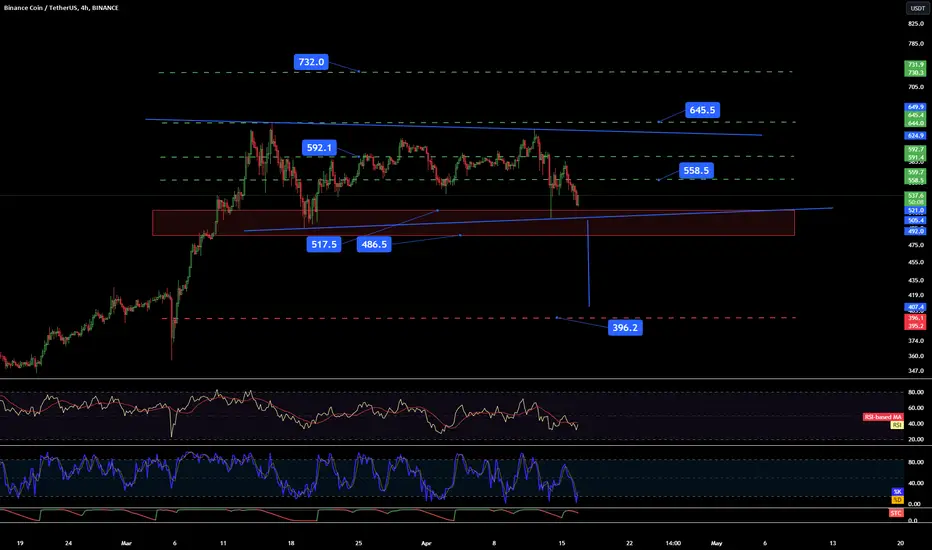
Hello everyone, let's look at the 4H BNB to USDT chart, as we can see the price is approaching the lower border of the horizontal trend channel, which is located in the support zone from $517 to $486, while a break from the bottom of the channel and a drop below this zone can give a strong downward movement towards the support level of $396.
Looking the other way, if the declines were stopped, the price has several significant resistance levels. And here you can see the first resistance at $558, then the second one at $592, the third one at the last peak at $645, and then you can see the way towards $732.
Looking at the RSI indicator, there is still room for a greater recovery, while the STOCH indicator indicates that the lower limit has been exceeded and confirms the current price rebound.
면책사항
해당 정보와 게시물은 금융, 투자, 트레이딩 또는 기타 유형의 조언이나 권장 사항으로 간주되지 않으며, 트레이딩뷰에서 제공하거나 보증하는 것이 아닙니다. 자세한 내용은 이용 약관을 참조하세요.
면책사항
해당 정보와 게시물은 금융, 투자, 트레이딩 또는 기타 유형의 조언이나 권장 사항으로 간주되지 않으며, 트레이딩뷰에서 제공하거나 보증하는 것이 아닙니다. 자세한 내용은 이용 약관을 참조하세요.