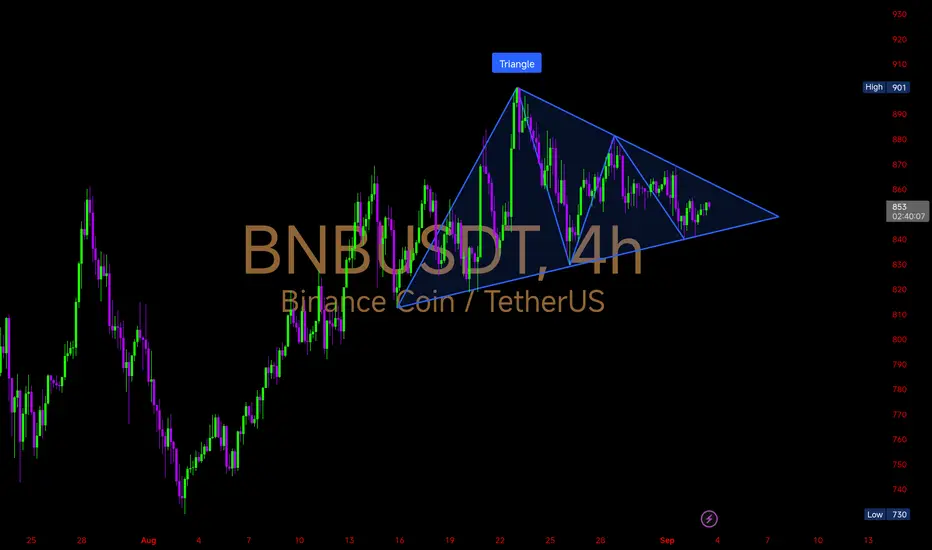
Price is consolidating inside a symmetrical triangle after the strong rally toward $901. This pattern signals a big breakout move ahead.
Key Levels
Upside Breakout Zone: $865 → $880 → $900
Downside Support Zone: $845 → $830 → $800
🔹A breakout above $865 could ignite momentum towards $900+, confirming trend continuation.
🔸 If price falls below $845, we may see a correction toward $820–800 before any recovery.
#BNB is coiling tighter. Expect volatility soon — whichever side breaks first will set the direction.
면책사항
해당 정보와 게시물은 금융, 투자, 트레이딩 또는 기타 유형의 조언이나 권장 사항으로 간주되지 않으며, 트레이딩뷰에서 제공하거나 보증하는 것이 아닙니다. 자세한 내용은 이용 약관을 참조하세요.
면책사항
해당 정보와 게시물은 금융, 투자, 트레이딩 또는 기타 유형의 조언이나 권장 사항으로 간주되지 않으며, 트레이딩뷰에서 제공하거나 보증하는 것이 아닙니다. 자세한 내용은 이용 약관을 참조하세요.