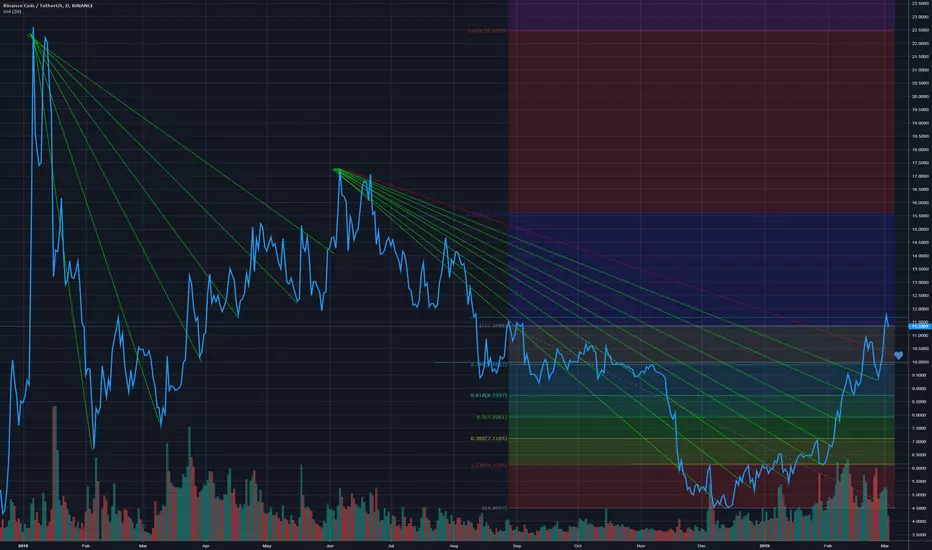
- Volumes are not enough to break the previous resistance, that's why in the past three days we have seen two strong resistances at 11.6$ which were not broken.
- If you look at green candlestick (1D timeframe), you will see that always, after 4/5 candlesticks the price recorrects itself by dropping. We are now at 4th.
- By looking at the green lines on the graphs, the uptrend follows a logic, which suggests a drop
- The main trend-line is almost in the "blu zone" with Fibonacci.
For these reasons I do not think it will go up now, but will drop and reach the heart point (about 10.5$), to recover after some day.
Be carefull guys.
면책사항
해당 정보와 게시물은 금융, 투자, 트레이딩 또는 기타 유형의 조언이나 권장 사항으로 간주되지 않으며, 트레이딩뷰에서 제공하거나 보증하는 것이 아닙니다. 자세한 내용은 이용 약관을 참조하세요.
면책사항
해당 정보와 게시물은 금융, 투자, 트레이딩 또는 기타 유형의 조언이나 권장 사항으로 간주되지 않으며, 트레이딩뷰에서 제공하거나 보증하는 것이 아닙니다. 자세한 내용은 이용 약관을 참조하세요.