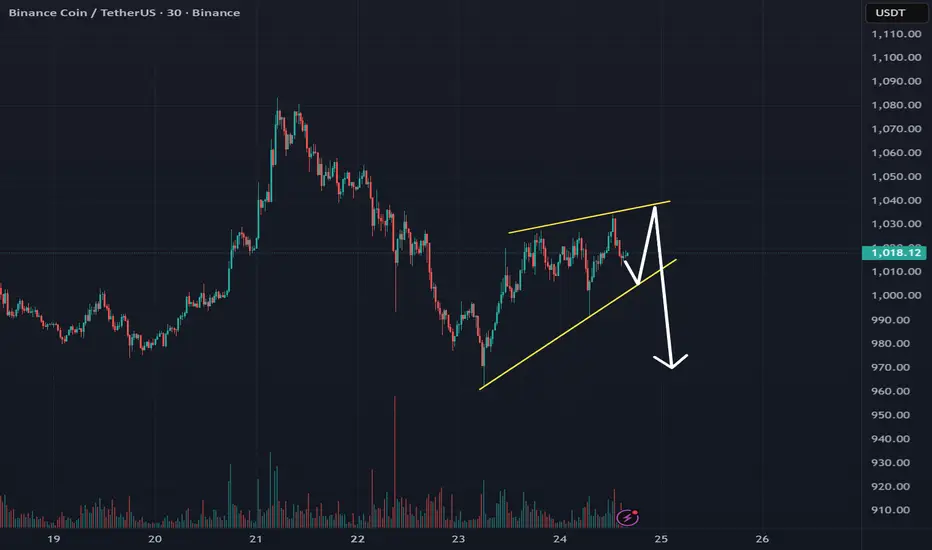
BNB is forming a bearish wedge pattern on the 15-minute chart
This pattern is bearish and formed within the boundaries of a global bearish flag pattern
Current price: $1016
According to the movement within the local wedge, a downward breakout is expected.
The price may reach $1000 and below
Within the pattern, false breakouts to $1050 are possible
---
More detailed analysis, additional charts, and key levels to watch are available on our website
면책사항
해당 정보와 게시물은 금융, 투자, 트레이딩 또는 기타 유형의 조언이나 권장 사항으로 간주되지 않으며, 트레이딩뷰에서 제공하거나 보증하는 것이 아닙니다. 자세한 내용은 이용 약관을 참조하세요.
면책사항
해당 정보와 게시물은 금융, 투자, 트레이딩 또는 기타 유형의 조언이나 권장 사항으로 간주되지 않으며, 트레이딩뷰에서 제공하거나 보증하는 것이 아닙니다. 자세한 내용은 이용 약관을 참조하세요.