BNB/USDT Weekly Chart Update
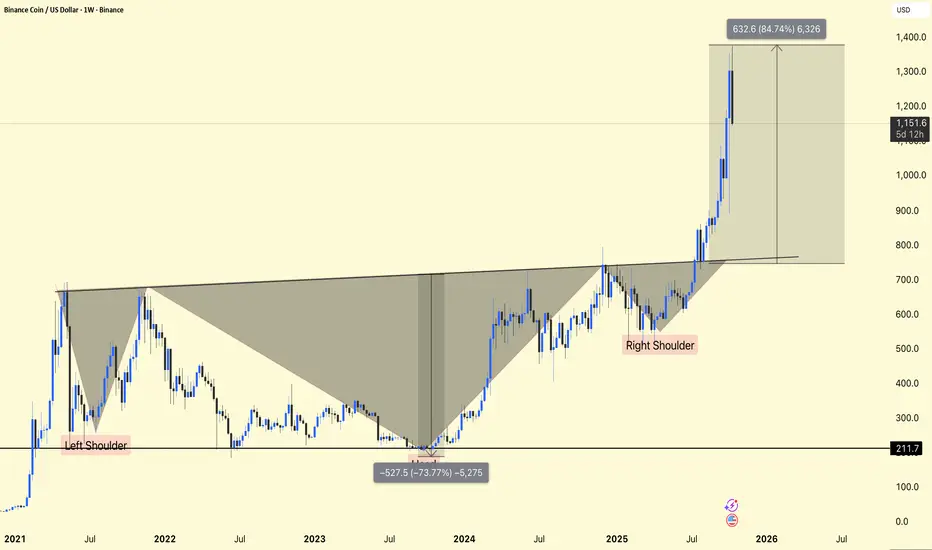
BNB has completed a massive inverse head and shoulders pattern on the weekly timeframe – a strong bullish reversal structure that confirms the long-term uptrend.
After breaking the $750 neckline, the price quickly rose to $1,230+, representing a gain of approximately +85% from the breakout zone. Current price activity remains strong, but a short-term decline towards $1,000-$1,100 would be good for continued downside.
Support: $800-$850 (neckline retest zone)
Short-term support: $1,000-$1,100
Target area: $1,350-$1,400
The breakout structure is bullish and intact – declines can be viewed as accumulation opportunities for the next leg up.
DYOR | NFA
관련 발행물
면책사항
이 정보와 게시물은 TradingView에서 제공하거나 보증하는 금융, 투자, 거래 또는 기타 유형의 조언이나 권고 사항을 의미하거나 구성하지 않습니다. 자세한 내용은 이용 약관을 참고하세요.
관련 발행물
면책사항
이 정보와 게시물은 TradingView에서 제공하거나 보증하는 금융, 투자, 거래 또는 기타 유형의 조언이나 권고 사항을 의미하거나 구성하지 않습니다. 자세한 내용은 이용 약관을 참고하세요.