I'm no mathematician so I kind of pulled these numbers out my ass to be honest. But hear me out.
Assuming the trend continues (on increasing market cycle time), then these are some guesstimated numbers of this market cycle's bottom and top.
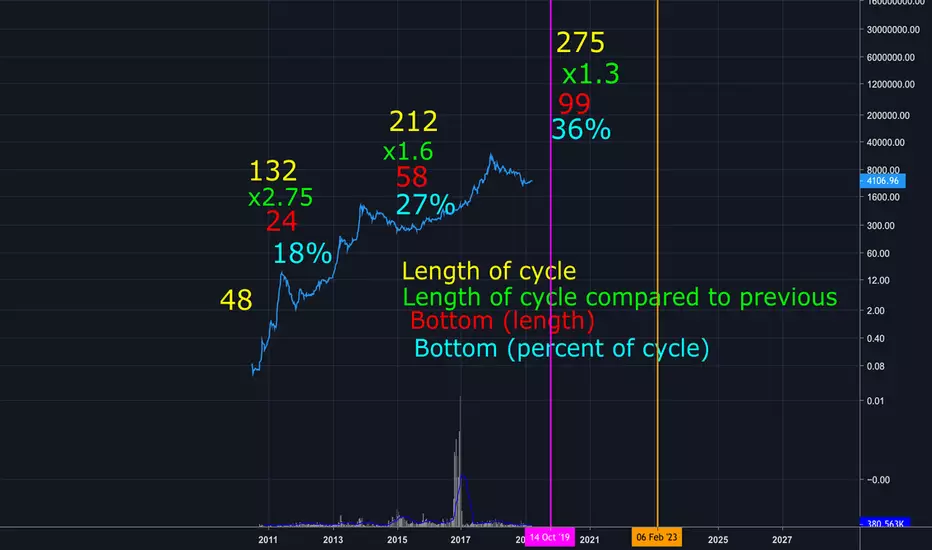
Pink vertical line is bottom, orange is top.
Bottom this autumn, with next top in 2022/2023.
Also note the time the market bottoms as a percent of the total trend time is getting later and later.
In the first cycle it bottomed at 18% of the cycle length, while the second cycle bottomed at 27% of the cycle length.
Believe it or not I'm not stoned making this post.
My guess is cryptos going to get real boring this year. Good luck everyone.
Assuming the trend continues (on increasing market cycle time), then these are some guesstimated numbers of this market cycle's bottom and top.
Pink vertical line is bottom, orange is top.
Bottom this autumn, with next top in 2022/2023.
Also note the time the market bottoms as a percent of the total trend time is getting later and later.
In the first cycle it bottomed at 18% of the cycle length, while the second cycle bottomed at 27% of the cycle length.
Believe it or not I'm not stoned making this post.
My guess is cryptos going to get real boring this year. Good luck everyone.
OP
면책사항
해당 정보와 게시물은 금융, 투자, 트레이딩 또는 기타 유형의 조언이나 권장 사항으로 간주되지 않으며, 트레이딩뷰에서 제공하거나 보증하는 것이 아닙니다. 자세한 내용은 이용 약관을 참조하세요.
면책사항
해당 정보와 게시물은 금융, 투자, 트레이딩 또는 기타 유형의 조언이나 권장 사항으로 간주되지 않으며, 트레이딩뷰에서 제공하거나 보증하는 것이 아닙니다. 자세한 내용은 이용 약관을 참조하세요.