Hello and thanks for reading into my post,
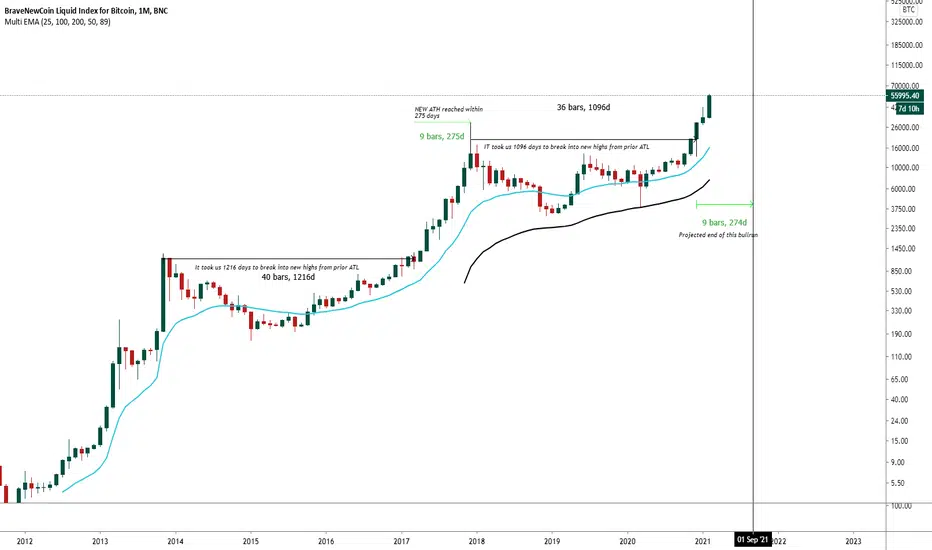
As you can see, I tried to project the current end of this bull run based on the old data we can view on the chart.
The first ATH we notice is the 2013 November top which has been at around 1100$ USD. -> From there on it took us 1216 days to break the prior ATH. -> At this point, we counted the days we closed above 1100$ until the new local top was reached in Dec 2017 at ~20.000$, in total it took us 275 days to reach the new ATH there.
Conclusion: if you take a closer look at today's structure, it's almost the same.
The second ATH was the 20.000$ Dec 2017 top. -> From there on it took us 1096 days to break the 20.000$ mark again. -> At this point, we start to project the old data into the new data, so theoretically we could take another 275 days of bullish action and place it into the chart -> This would project the 01. September 2021 as our new ATH.
How much it will rise is not defined.
What do you think about this quick analysis? Would love to hear you thoughts,
Greets
The Doc Doc Pleb
KSC
면책사항
이 정보와 게시물은 TradingView에서 제공하거나 보증하는 금융, 투자, 거래 또는 기타 유형의 조언이나 권고 사항을 의미하거나 구성하지 않습니다. 자세한 내용은 이용 약관을 참고하세요.
KSC
면책사항
이 정보와 게시물은 TradingView에서 제공하거나 보증하는 금융, 투자, 거래 또는 기타 유형의 조언이나 권고 사항을 의미하거나 구성하지 않습니다. 자세한 내용은 이용 약관을 참고하세요.